New Dashboard Meters and Alerts Retention Policy #181
Conversation
influxdb/run-once-2.8.3.sql
Outdated
| # USE powerwall | ||
| CREATE DATABASE powerwall | ||
| # Copy alert data from raw into alerts | ||
| SELECT * INTO "powerwall"."alerts"."alerts" FROM "powerwall"."raw"."alerts" GROUP BY * |
There was a problem hiding this comment.
@mcbirse - Would love your feedback on this. I need this to copy all the alerts data from from "raw" to the "alerts" retention policy (moving it from 3-day to separately controllable infinite retention). Does the GROUP BY * honor the tags we want to preserve?
There was a problem hiding this comment.
Hi @jasonacox - the GROUP BY * will copy all of the tags, which I believe is what we would want in this case to be consistent with data logged to the new alerts retention policy.
NOTE: that is month & year tags, as well as several tags that are added by telegraf (url & host) since the data is being logged directly to the retention policy, rather than via a CQ by the looks of it (all defined CQ's are only storing month & year tags, so url & host are normally dropped).
I tested the changes & the SELECT INTO query, and all of the tags were copied (see below - points before the gap is the data copied from raw, and after the gap is newly logged data now going into the alerts retention policy instead of raw).
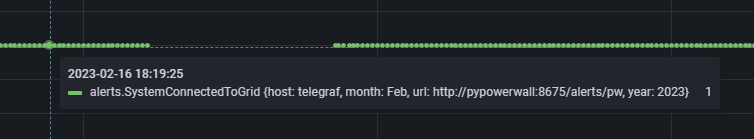
All looks good I think. I wonder how much space this will take up since alert data will be stored every 5s forever. On the other hand, great to have that alert history for more than just 3 days, as it could help identify system issues!
There was a problem hiding this comment.
I wonder how much space this will take up since alert data will be stored every 5s forever.
@jasonacox - I was having a look at this, and just wondering if it would be preferred to down sample the alert data to per minute intervals instead of every 5 seconds? i.e. if an alert occurred at all within a minute (returned value of 1) it would be logged.
Or do we want/need 5s granularity of alert data forever? (I'm not sure myself, or how important this may be?)
I think it is possible to create a CQ for alerts, however there are some caveats. The field names would be changed and prefixed by the function name used in the CQ (e.g. max_field_name), and we don't know what the field names could be so it is not really feasible to rename them with e.g. "AS field_name".
However, the display of the alert names can be changed in Grafana by using a Rename by regex transform on the field names, so it would still appear the same in the dashboard. Thoughts?
There was a problem hiding this comment.
@jasonacox - Just FYI, I have worked out the changes that would be required to use a CQ with the alert data downsampled from raw to 1 minute intervals, depending on your preference of course.
I could submit a PR to this branch for review if you like.
Summary of changes:
- Revert telegraf.conf changes (not required)
- Add the alerts retention policy (as per existing change already made to influxdb.sql)
- Add a CQ cq_alerts that would downsample the data from raw.alerts
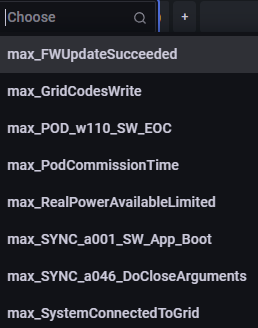
- Changes to dashboard.json - select data from the downsampled rp, and update all field names as they will be prefixed with "max_", and add a rename by regex transform to the field names so they are displayed without the "max_" prefix
- Update the run-once.sql script to replicate the CQ so the current last 3d of data is copied to the new rp for alerts (have not tested this yet)
I tested this today with per minute downsampled data:
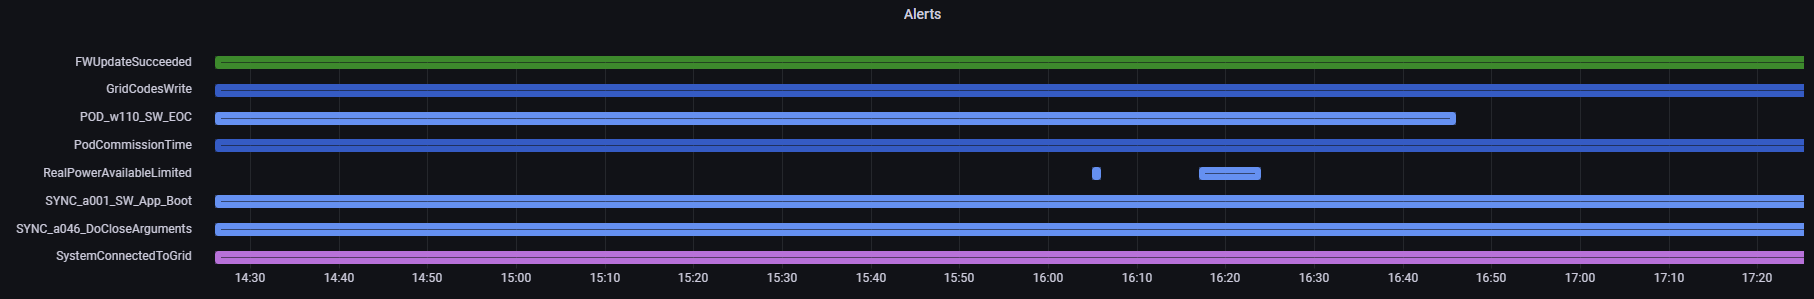
Appears to work.
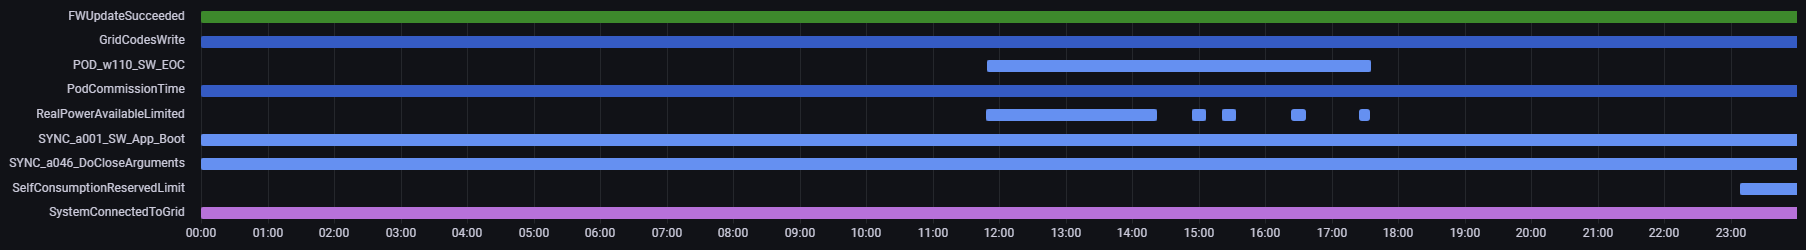
Just for interest, this ended up being a good test of the "on/off" nature of an alert, and that even when downsampling an alert that may have only been active for e.g. 5 seconds within the 1 minute, it was still logged.
In the above alerts, where you can see "RealPowerAvailableLimited" was active very briefly, when I check the raw data there was only 1 data point logged in a 5 second period, however this was still downsampled correctly to the per minute data.
Caveats?
- We would only know within the minute of when an alert occurred (not the approx second)
- All the field names logged to the alerts rp will start with "max_" (as I used the max function in the CQ)
Can anyone think of any other problems or their preference regarding this?
There was a problem hiding this comment.
WOW! Thanks @mcbirse !! I love it!!! You're amazing.
I was also concerned about the storage for the retention. It seems to be low in my testing, since it is only storing field + 1's, but it would still add up and it wouldn't be as good as your proposed solution.
1 - the minute quanta is reasonable. If you did a 20 second "off grid" test, it wouldn't give you the right duration (would show 1m I assume) but it would show that alerts that fired. I think this is a good tradeoff for the space saved. If someone needs the precise seconds while doing research/troubleshooting and it happened within last 3 days, they can manually switch to the "raw" data.
2 - Field names - I can't see a problem with this since you rewrite it for the dashboard (which is brilliant by the way!). I contemplated adding regex overrides for extreme errors (anomalies showing battery failure for example) but these don't exist yet and would just need to accommodate the prefix.
Please submit your PR! 🙏
There was a problem hiding this comment.
No worries Jason, I will submit the PR tonight or tomorrow.
Just testing the changes at the moment. I actually noticed another benefit of downsampling the data to per minute intervals.
If an alert had triggered for a brief period within a minute, when the alert data was being displayed from raw (i.e. the per 5s data), some alerts may not be displayed when the dashboard is being viewed for a 24h time period (which I think most people do), so could be easily missed - unless you zoomed in.
Example below - this is alert data displayed from raw:
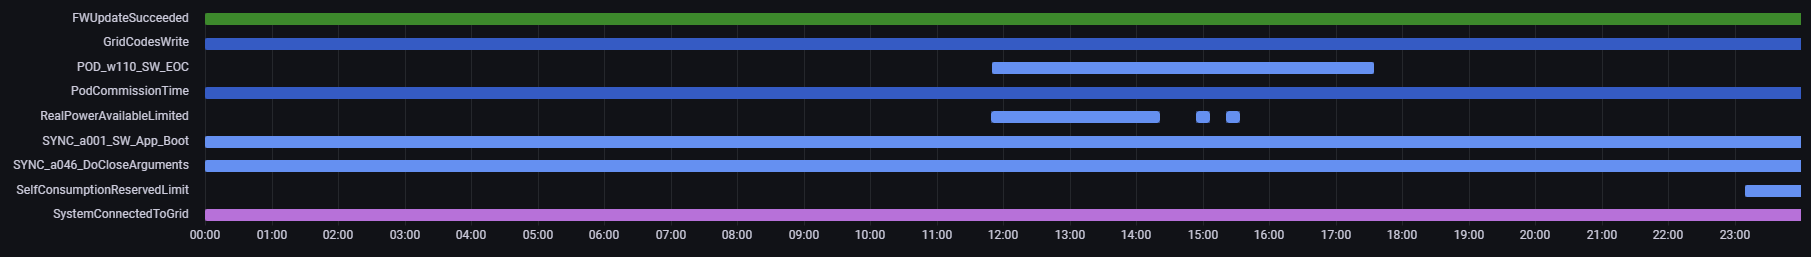
And below is showing the same alert data, but displayed from the new alerts rp (downsampled to per minute data):
You can see some alerts that were triggered briefly for "RealPowerAvailableLimited" whereas they are not being shown in the first graph (unless I zoom in on that time period).
I think this setup will give us the best of both worlds! i.e. being able to easily spot an alert that occurred, even for a brief moment. And as per your comments in point 1 above - if further investigation is required, you can explore the "raw" data for that alert to identify close to exact timings of when it occurred (as long as it is noticed within the last 3 days).
There was a problem hiding this comment.
Wow! Yes! That's fantastic. I noticed this a few times (including having alerts that showed a row but didn't show any line). The whole point of this panel is to get a quick view into what alerts fire and when. This will raise the visibility into those alerts. Thank you!
There was a problem hiding this comment.
@jasonacox - I have submitted a PR to be merged to your 2.8.3 branch. Wasn't sure how this works... but hopefully you can merge those changes to your 2.8.3 branch, and then you would merge to main from this PR?
|
This got me thinking - should there be CQs and retention policies for Weather411 (and if there are, I guess I need to set up for ecowittweather as well). Actually, to be honest, I thought there should be for ecowittweather, and went looking for weather411, and couldn't find anything. Is that because I don't know where to look? |
|
Hi @BJReplay - For Weather411 and the ecowittweather services, CQ's are not required. These services are logging data by default every 10mins only (configurable setting) directly to InfluxDB (not via telegraf). I think we only really need to consider adding CQ's for data logged to InfluxDB via telegraf, i.e. to raw, as the data is logged every 5 seconds (hence why raw only keeps data for 3 days). We should consider downsampling that data in the interests of storage space I would think, unless of course we really do need granularity of data points every 5 seconds. |
|
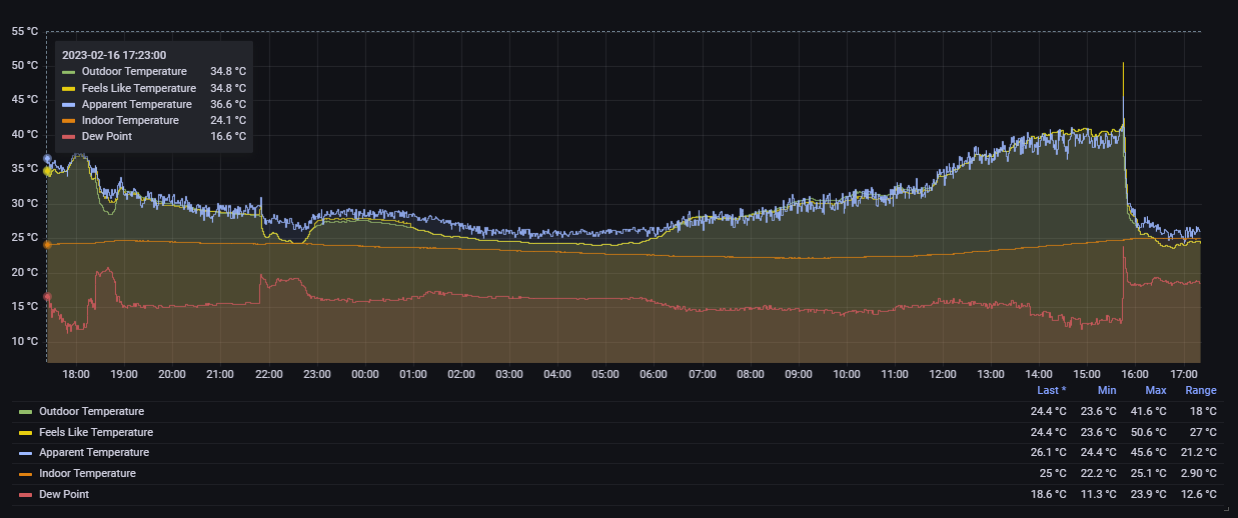
Hi @mcbirse I've got ecowittweather logging every minute (just because I can 🙂 I guess) - but also because I do get nice weather charts out of it - including the temperature drop this afternoon from a momentarily high feels like of 50.6° for just one minute as the humidity climbed with the wind change before the temperature dropped to 29.9° just five minutes later - which I would have missed with 10 minute logging. It's still less than 1/10 the faster logging of every five seconds. But given what you've said, I now understand why they're not there for Weather411. Thanks for the explanation.
|
Add alerts CQ and revert telegraf changes, update run-once and dashboard
v2.8.3 - New Dashboard Meters