Improve contrast of interaction heatmaps #236
Description
First of all, I'm impressed by the visualizations of the package. Thanks a lot for all your efforts.
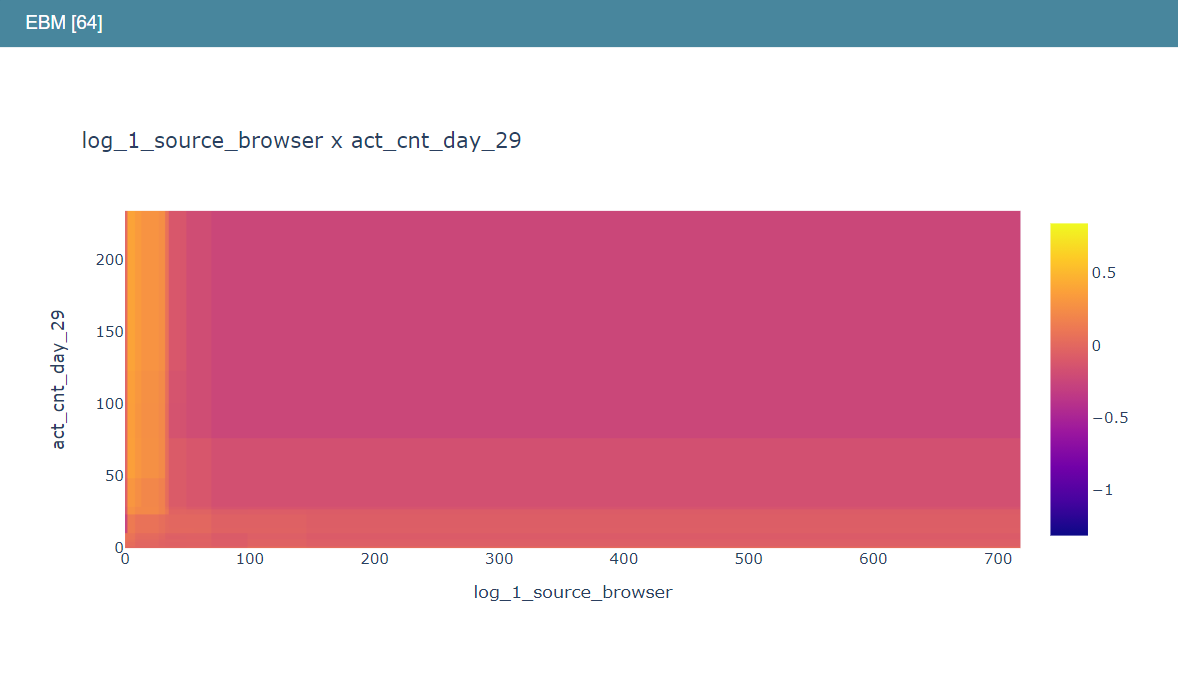
I do have a question regarding the contrast of the heatmaps. The heatmaps use global scores range to initialize their color bar.
This results in a rather large range per interaction feature resulting in little contrast in the plot:
If the range of the interaction feature would be used, there is much more contrast and this might help interpretation:

code in interpret/python/interpret-core/interpret/visual/plot.py, line 606:
def plot_pairwise_heatmap(data_dict, title="", xtitle="", ytitle=""):
    if data_dict.get("scores", None) is None:  # pragma: no cover
        return None

    bin_labels_left = data_dict["left_names"]
    bin_labels_right = data_dict["right_names"]
    bin_vals = data_dict["scores"]

    bin_vals = np.ascontiguousarray(np.transpose(bin_vals, (1, 0)))

    heatmap = go.Heatmap(z=bin_vals, x=bin_labels_left, y=bin_labels_right)
    # if data_dict.get("scores_range", None) is not None:
    #     heatmap["zmin"] = data_dict["scores_range"][0]
    #     heatmap["zmax"] = data_dict["scores_range"][1]

    # Tweak to increase contrast of plot
    heatmap["zmin"] = bin_vals.min()
    heatmap["zmax"] = bin_vals.max()

    layout = go.Layout(title=title, xaxis=dict(title=xtitle), yaxis=dict(title=ytitle))
    figure = go.Figure(data=[heatmap], layout=layout)

    return figure
Would that be an easy change or should it be changed in the explanation object? Or is there a reason not to change this?