📊 High-quality, publication-ready charts using Apache ECharts, inspired by the aesthetics of ggplot2.
This project provides a set of reusable ECharts chart templates and themes that mimic the clean, minimal, and publication-ready style popularized by R's ggplot2.
While ggplot2 is the gold standard in R for beautiful statistical plots, many web-based dashboards and publications require interactive JavaScript visualizations. Apache ECharts is powerful but its default theme is not publication-focused.
This repo bridges that gap by:
- Offering custom ggplot-like themes for ECharts
- Providing reusable ECharts chart components in
TypeScriptorJavaScript - Creating high-resolution, vector-exportable charts suitable for scientific publication
- 🎨 ggplot-style themes for ECharts
- 📈 Chart templates: line, bar, scatter, boxplot, violin, etc.
- 🧑💻 Written in TypeScript with React & ECharts-for-React
- 📄 Export options: SVG / PNG / PDF (via
html2canvasorsvg-crowbar) - 📊 Beautiful typography, spacing, and grid control
- 🌐 Web-ready, suitable for blog posts, papers, and reports
🔬 Note: Currently works with ECharts v6, which is not released yet. You need to clone and build ECharts locally. See Setup for instructions.
| Violin Plot | Contour Plot |
|---|---|
violin  |
contour  |
| Stage View | Segmented Doughnut |
|---|---|
stage  |
segmentedDoughnut  |
| Bar Range | Line Range |
|---|---|
barRange  |
lineRange  |
🎯 Each chart includes support for ggplot-style themes, hover interactions, and is SVG-friendly for high-quality export.
All charts follow these ggplot-style design principles:
- ✅ Minimalist grid and axis lines
- ✅ Balanced white space and layout
- ✅ Scientific typography
- ✅ Publication-friendly color palettes
- ✅ Exportable to SVG for high-resolution reports
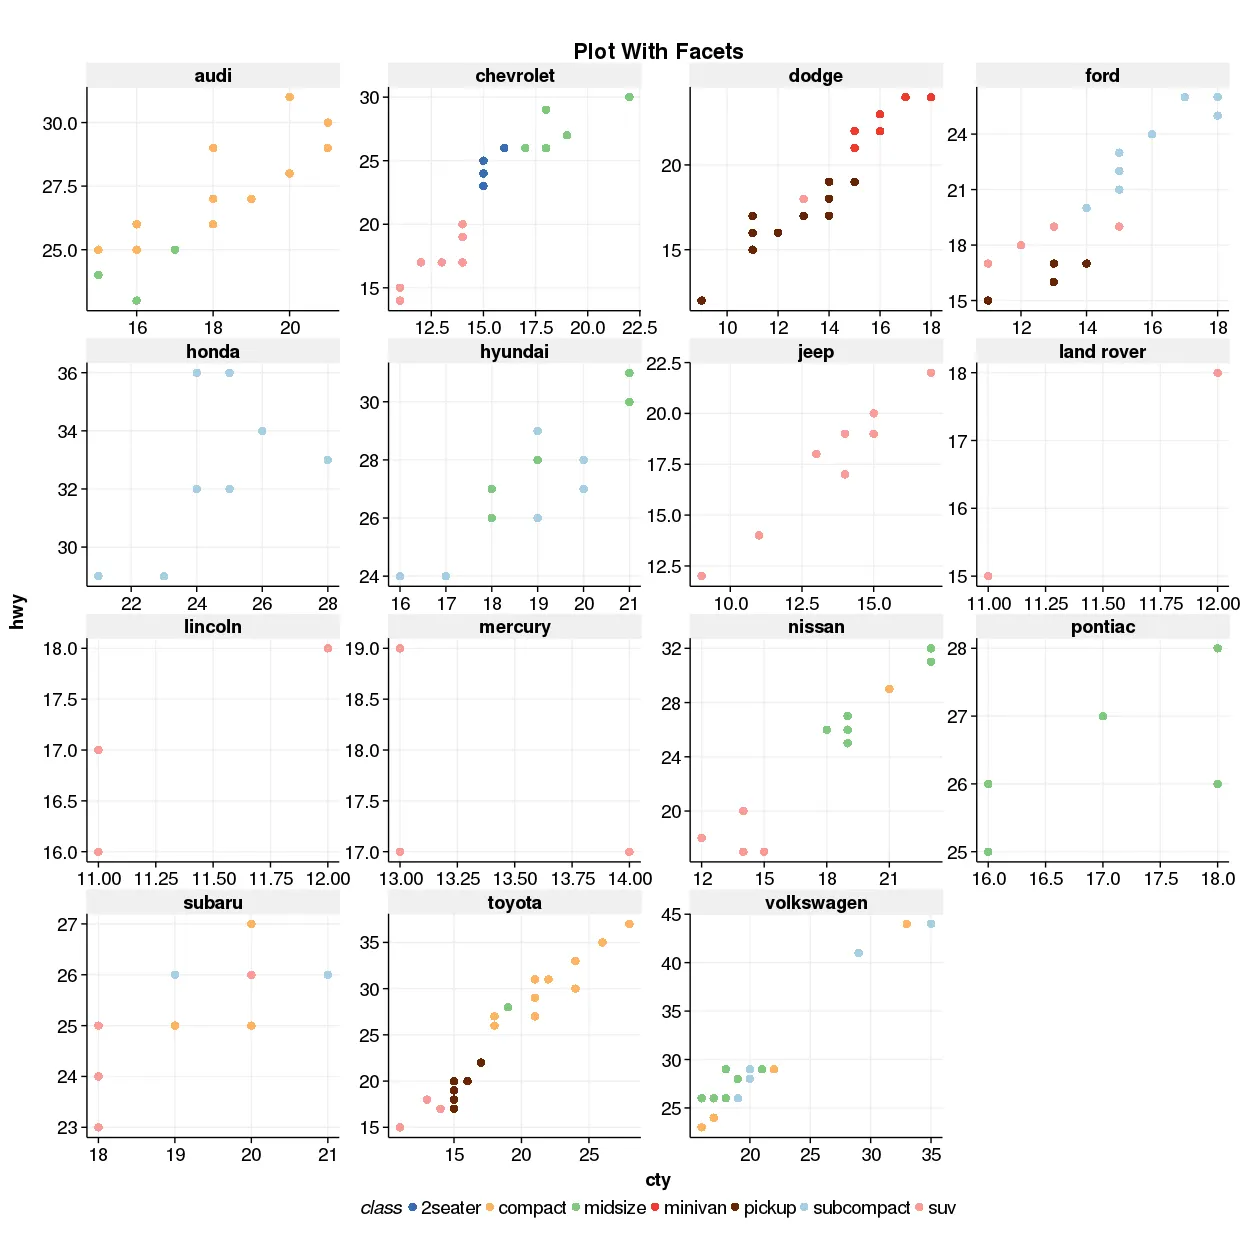
Example of scatter with ggplot-like styling
npm installSince ECharts v6 is still unreleased, you’ll need to build and link it manually:
# Under apache/zrender
git checkout v6
npm install
npm run prepare
npm link

# Under apache/echarts
git checkout v6
npm install
npm link zrender
npm link
npm run prepare
npm run build

# In echarts-custom-series
cd custom-series/<series-name>
npm link echartsnpm run generate <seriesName>Use camelCase for multi-word names:
✅barRange| ❌bar-range
npm run buildnpm run build <series-name>Example:
npm run build violinnpm run thumbnail
# or only one
npm run thumbnail violinThese will appear in /screenshots and update the README preview.
TODO: Coming soon.
- Violin and density plots
- Line/Bar with ranges (confidence intervals)
- ggplot-style themes
- Boxplot, Beeswarm, Histogram
- Export helper: SVG / PNG / PDF
- Playground site with live editing
Pull requests are welcome! You can contribute new custom series, themes, or export helpers.
MIT © 2025 # echart-ggplot-style