support cmap parameter for line plots #652
Description
I have a dataframe data with three dimensions (x,y,z) and I'd like to create a line plot where the color of the line is set by a colormap rather than randomly-chosen colors.
currently I can do
data.hvplot(x='x', y='y', by='z', cmap='Reds')which gives nearly the appropriate plot, except that the cmap parameter is ignored. This causes problems when z is a continuous variable rather than a categorical variable because in that case, a sequential colormap is necessary to shade each line appropriately (instead of the default categorical colormap). I'd like for the cmap parameter to be recognized in line graphs as it is with other types, e.g. scatter
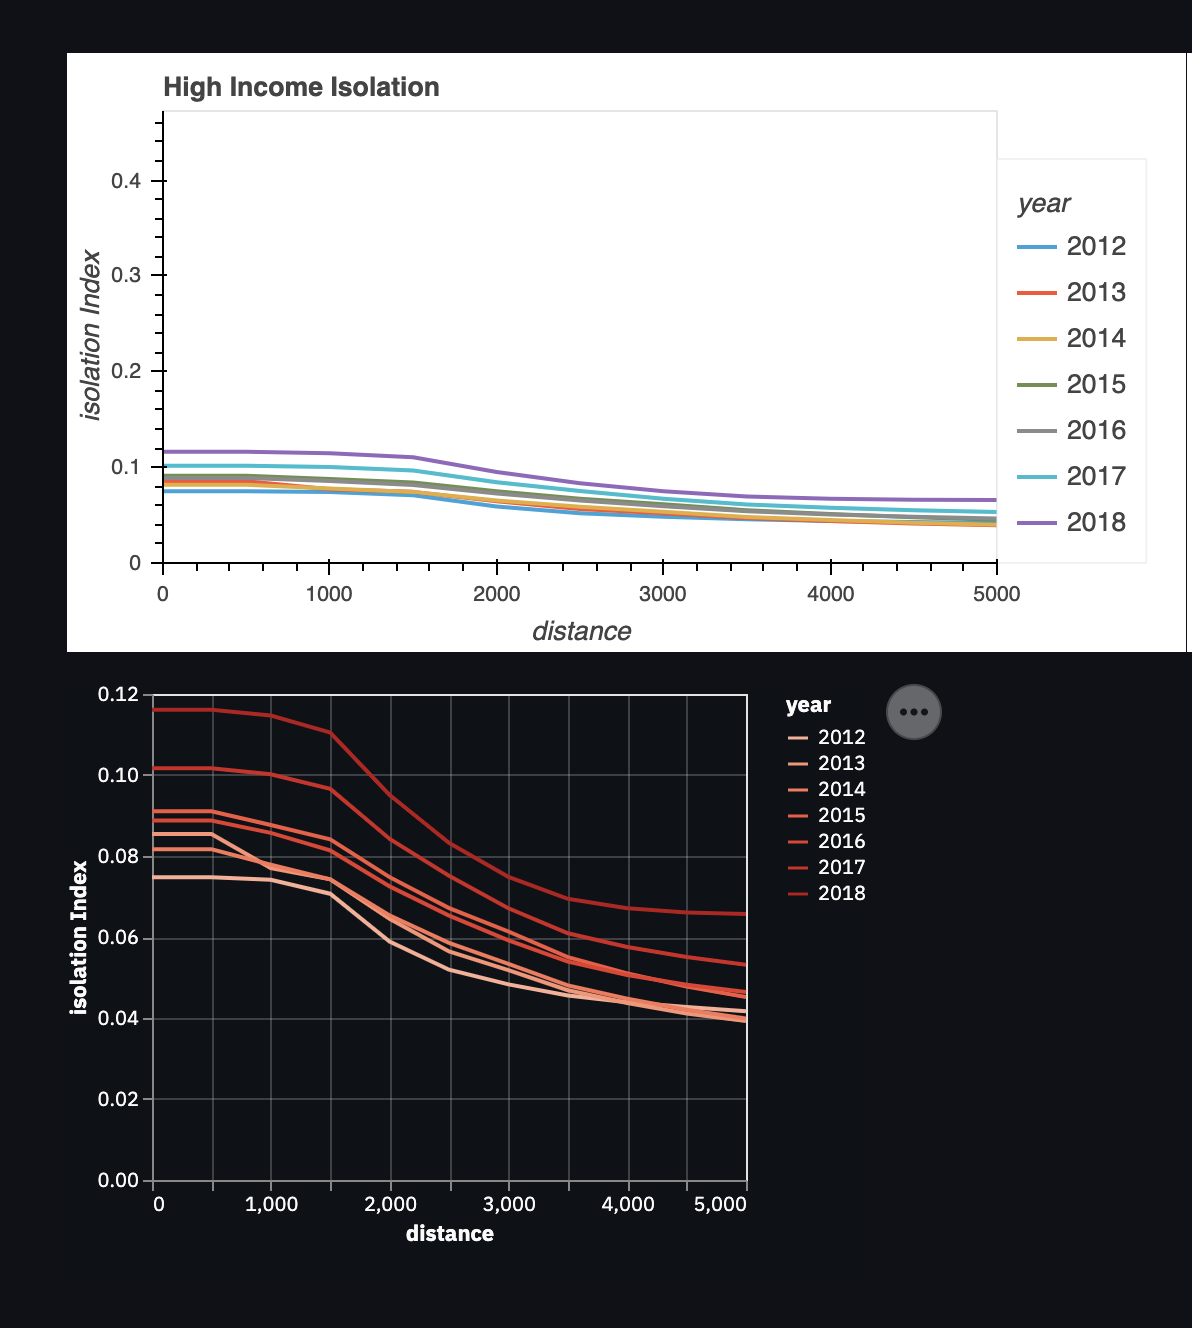
for example using hvplot I can do
data.hvplot(x='distance', y='Index', by='year', cmap="reds")
which yields the top figure below (ignoring 'cmap`). Instead, I'd like to generate something like the bottom figure (created using Altair)