

Graphsignal is a production-scale inference profiling platform that helps engineers optimize AI performance across models, engines, GPUs, and other accelerators. It provides essential visibility across the inference stack, including:
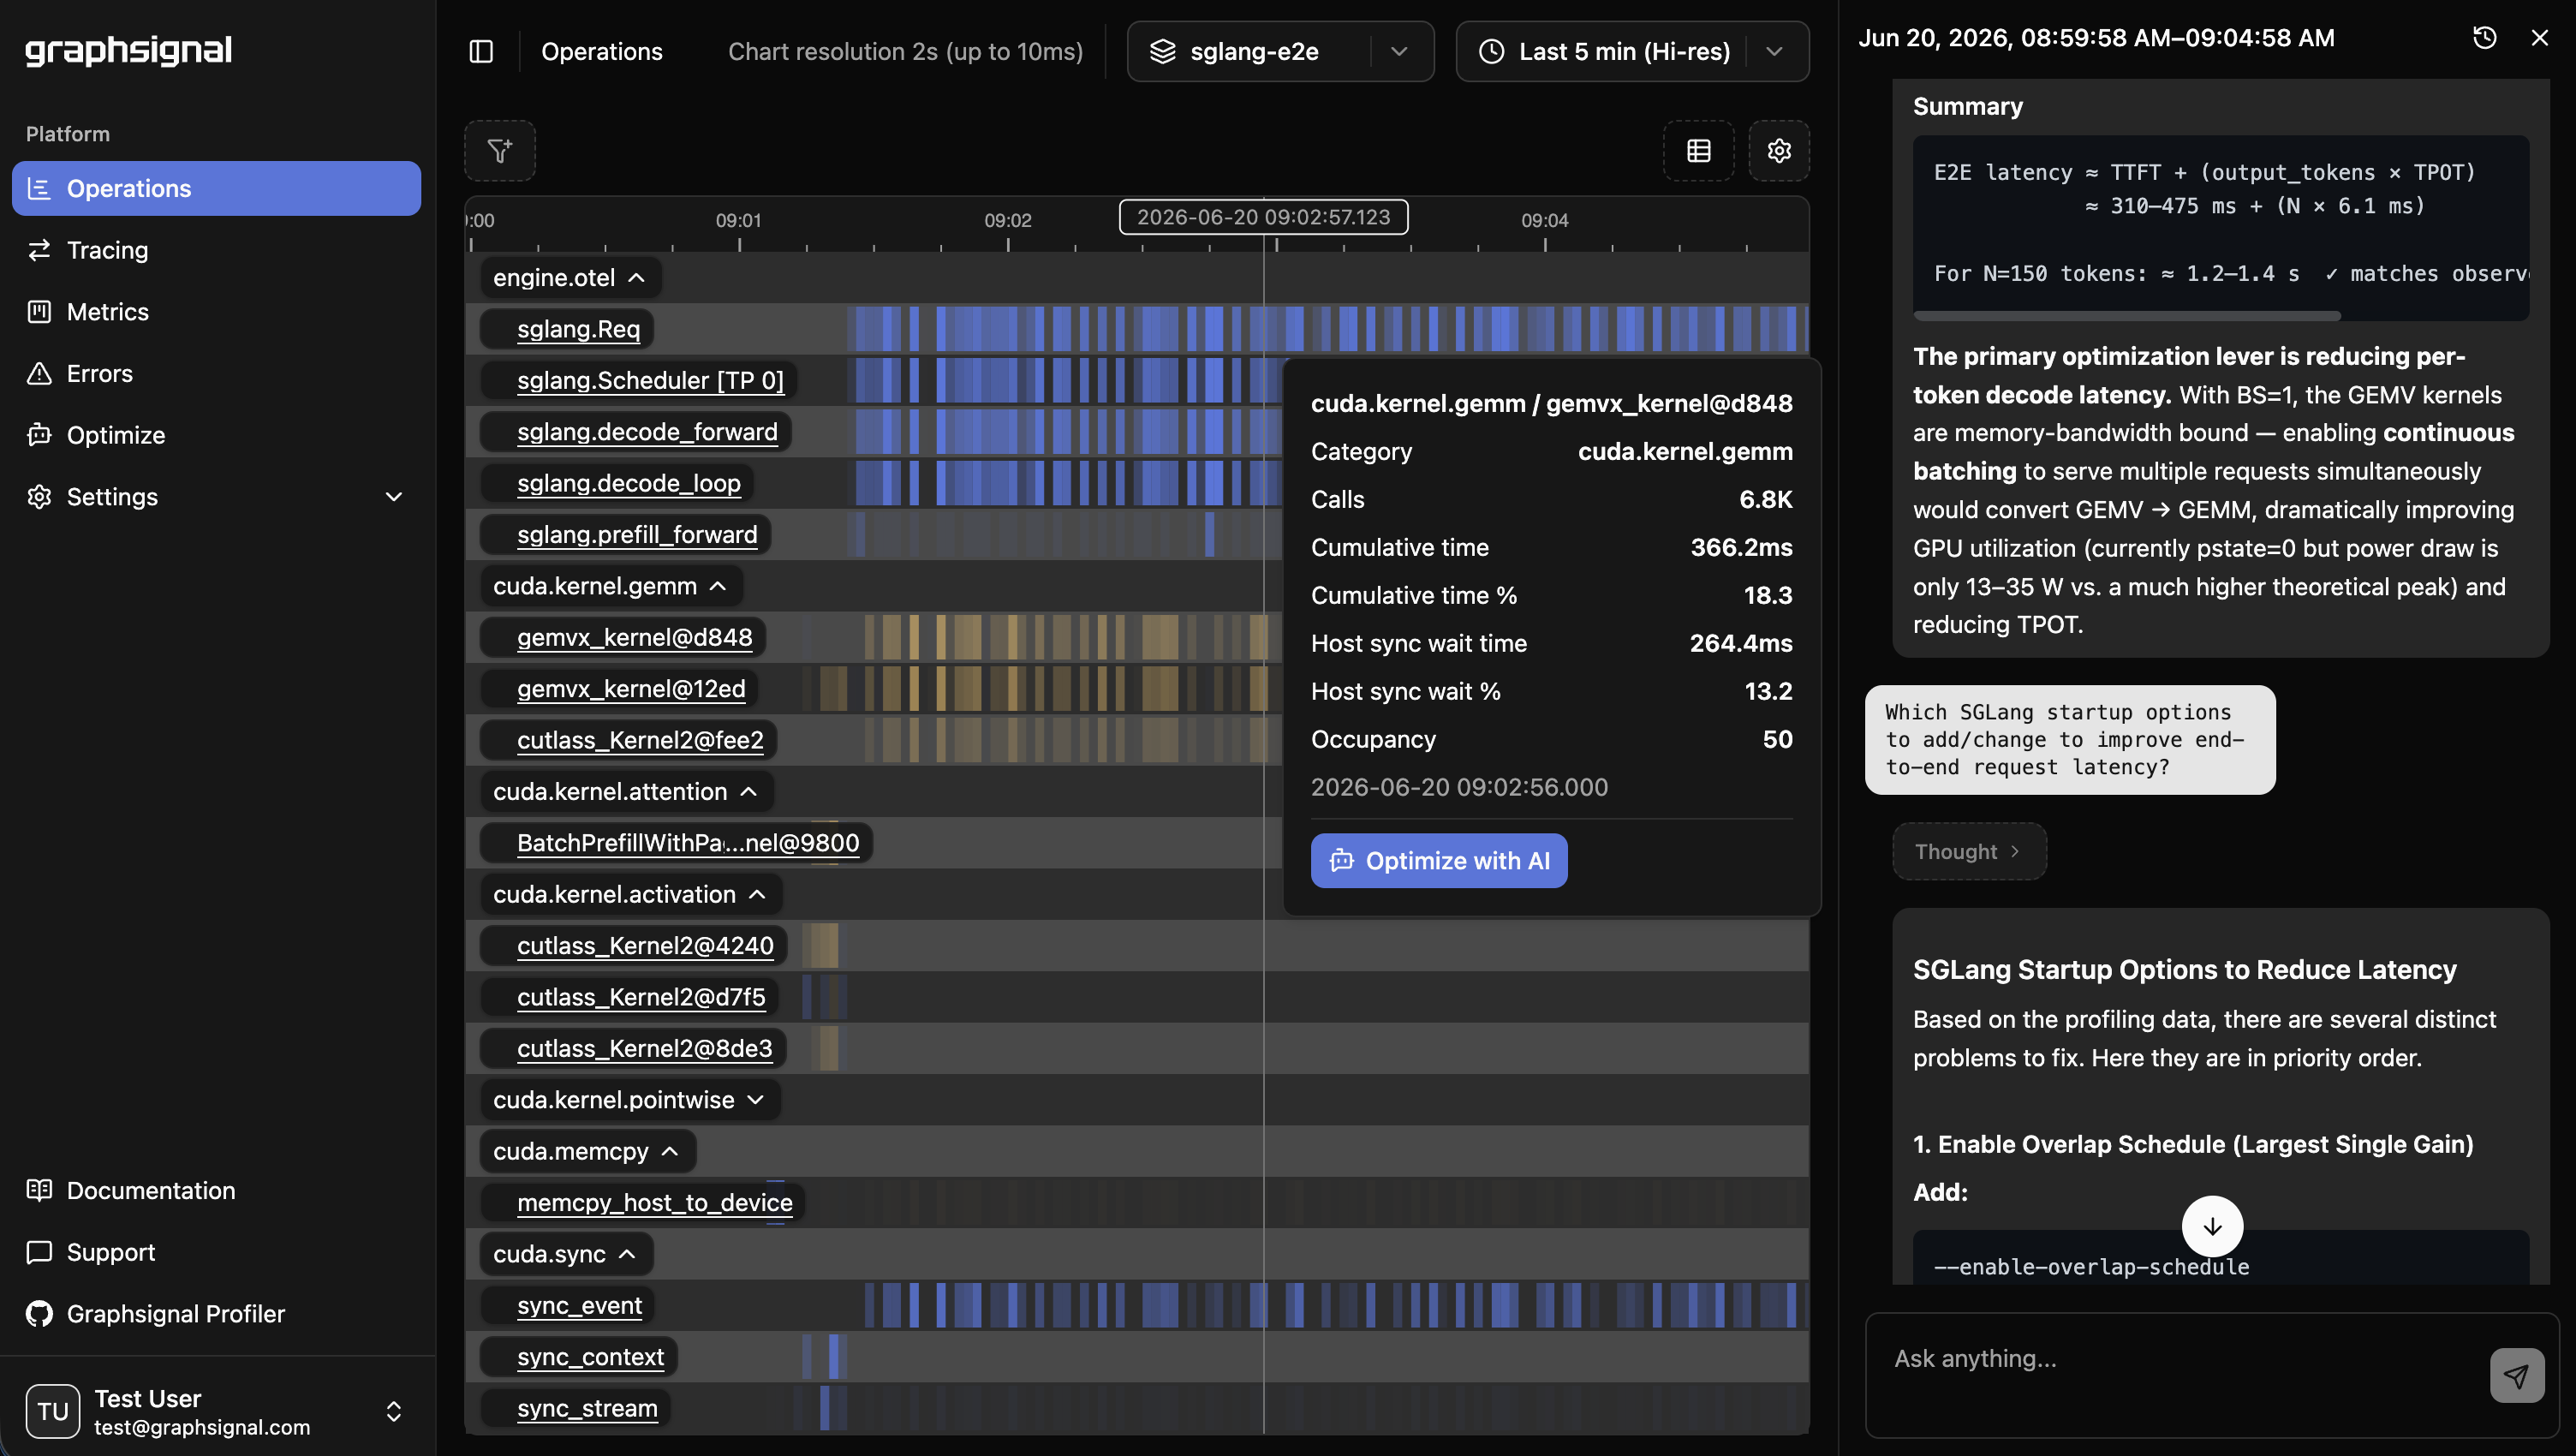
- Continuous, high-resolution profiling timelines exposing operation durations and resource utilization across inference workloads.
- LLM generation tracing with per-step timing, token throughput, and latency breakdowns for major inference frameworks.
- System-level metrics for inference engines and hardware (CPU, GPU, accelerators).
- Error monitoring for device-level failures and inference errors.
- Automatic engine flag optimization, AI chat for bottleneck investigation, and profiling context for AI coding agents.
Learn more at graphsignal.com.
UV_TOOL_BIN_DIR=/usr/local/bin uv tool install 'graphsignal[cu12]'   # CUDA 12.x
# or
UV_TOOL_BIN_DIR=/usr/local/bin uv tool install 'graphsignal[cu13]' # CUDA 13.xIf you prefer a single environment, or you use the graphsignal.watch() Python API (which requires graphsignal importable by your application), install it directly into your workload's environment instead:
pip install 'graphsignal[cu12]'   # CUDA 12.x
# or
pip install 'graphsignal[cu13]' # CUDA 13.xWrap your launch command with graphsignal-run:
export GRAPHSIGNAL_API_KEY=<my-api-key>
graphsignal-run vllm serve <model> --port 8001
Environment variables read by the profiler:
| Variable | Purpose |
|---|---|
GRAPHSIGNAL_API_KEY (required) |
Your account API key. |
GRAPHSIGNAL_TAG_<KEY>=<value> |
Arbitrary tag attached to all signals (e.g. GRAPHSIGNAL_TAG_DEPLOYMENT=us-prod). |
Sign up for a free account at graphsignal.com; you'll find the API key in Settings / API Keys.
See the Profiler CLI reference for the full set of options.
Applications that bootstrap themselves can call graphsignal.watch() from Python instead — see the Profiler API reference.
See integration documentation for libraries and inference engines:
Log in to Graphsignal to monitor and analyze your application.
Three ways to optimize with AI:
- Auto-flags —
graphsignal-run --auto-flagssets engine flags at launch - Optimize chat — ask questions about a time window in the Graphsignal app
- graphsignal-context — let an AI coding agent (Claude Code, Codex, or Gemini) fetch and analyze profiling data in your IDE
See AI Optimization for details.
The profiler has minimal impact on production performance. CUDA kernel activity is collected via CUPTI with low-overhead APIs, and analysis and upload happen in the sidecar process.
The profiler only establishes outbound connections to api.graphsignal.com to send data; inbound connections or commands are not possible.
Content and sensitive information, such as prompts and completions, are not recorded.
If something doesn't look right, report it to our support team via your account.
In case of connection issues, please make sure outgoing connections to https://api.graphsignal.com are allowed.