Skip to content

Conversation

eh-am
Copy link
Collaborator

@eh-am eh-am commented Aug 24, 2021

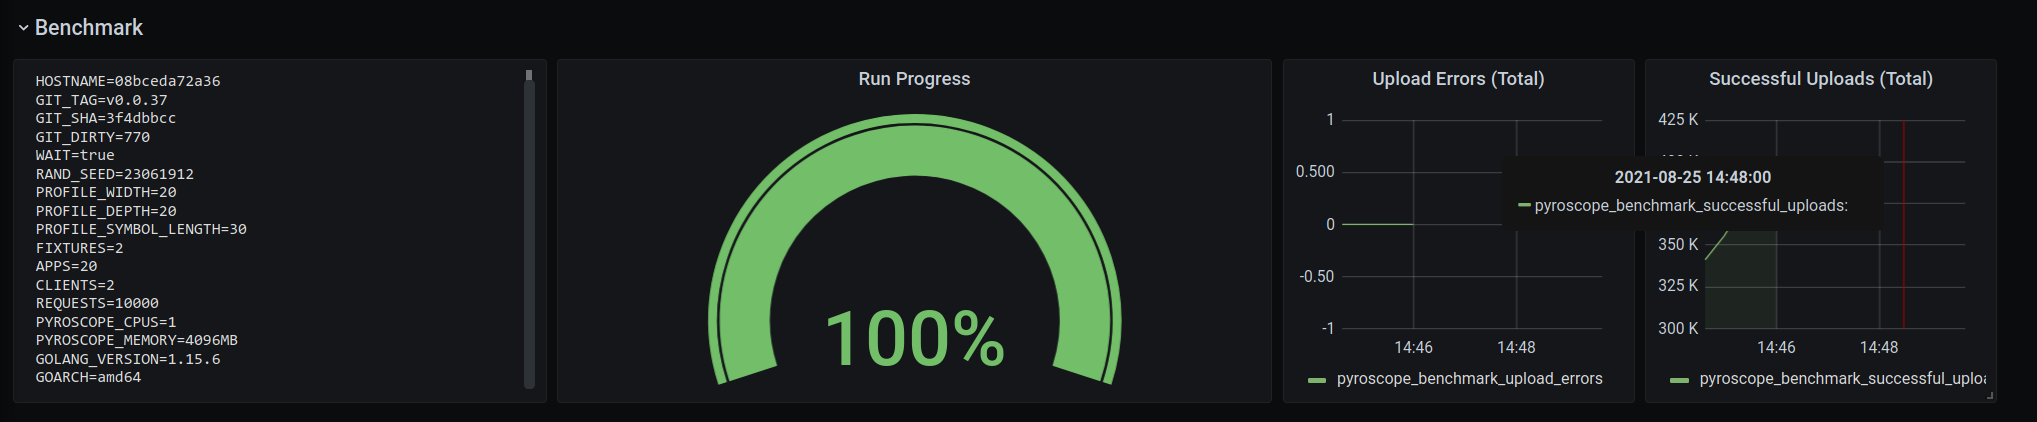
Creates a benchmark dashboard based on the user facing one.
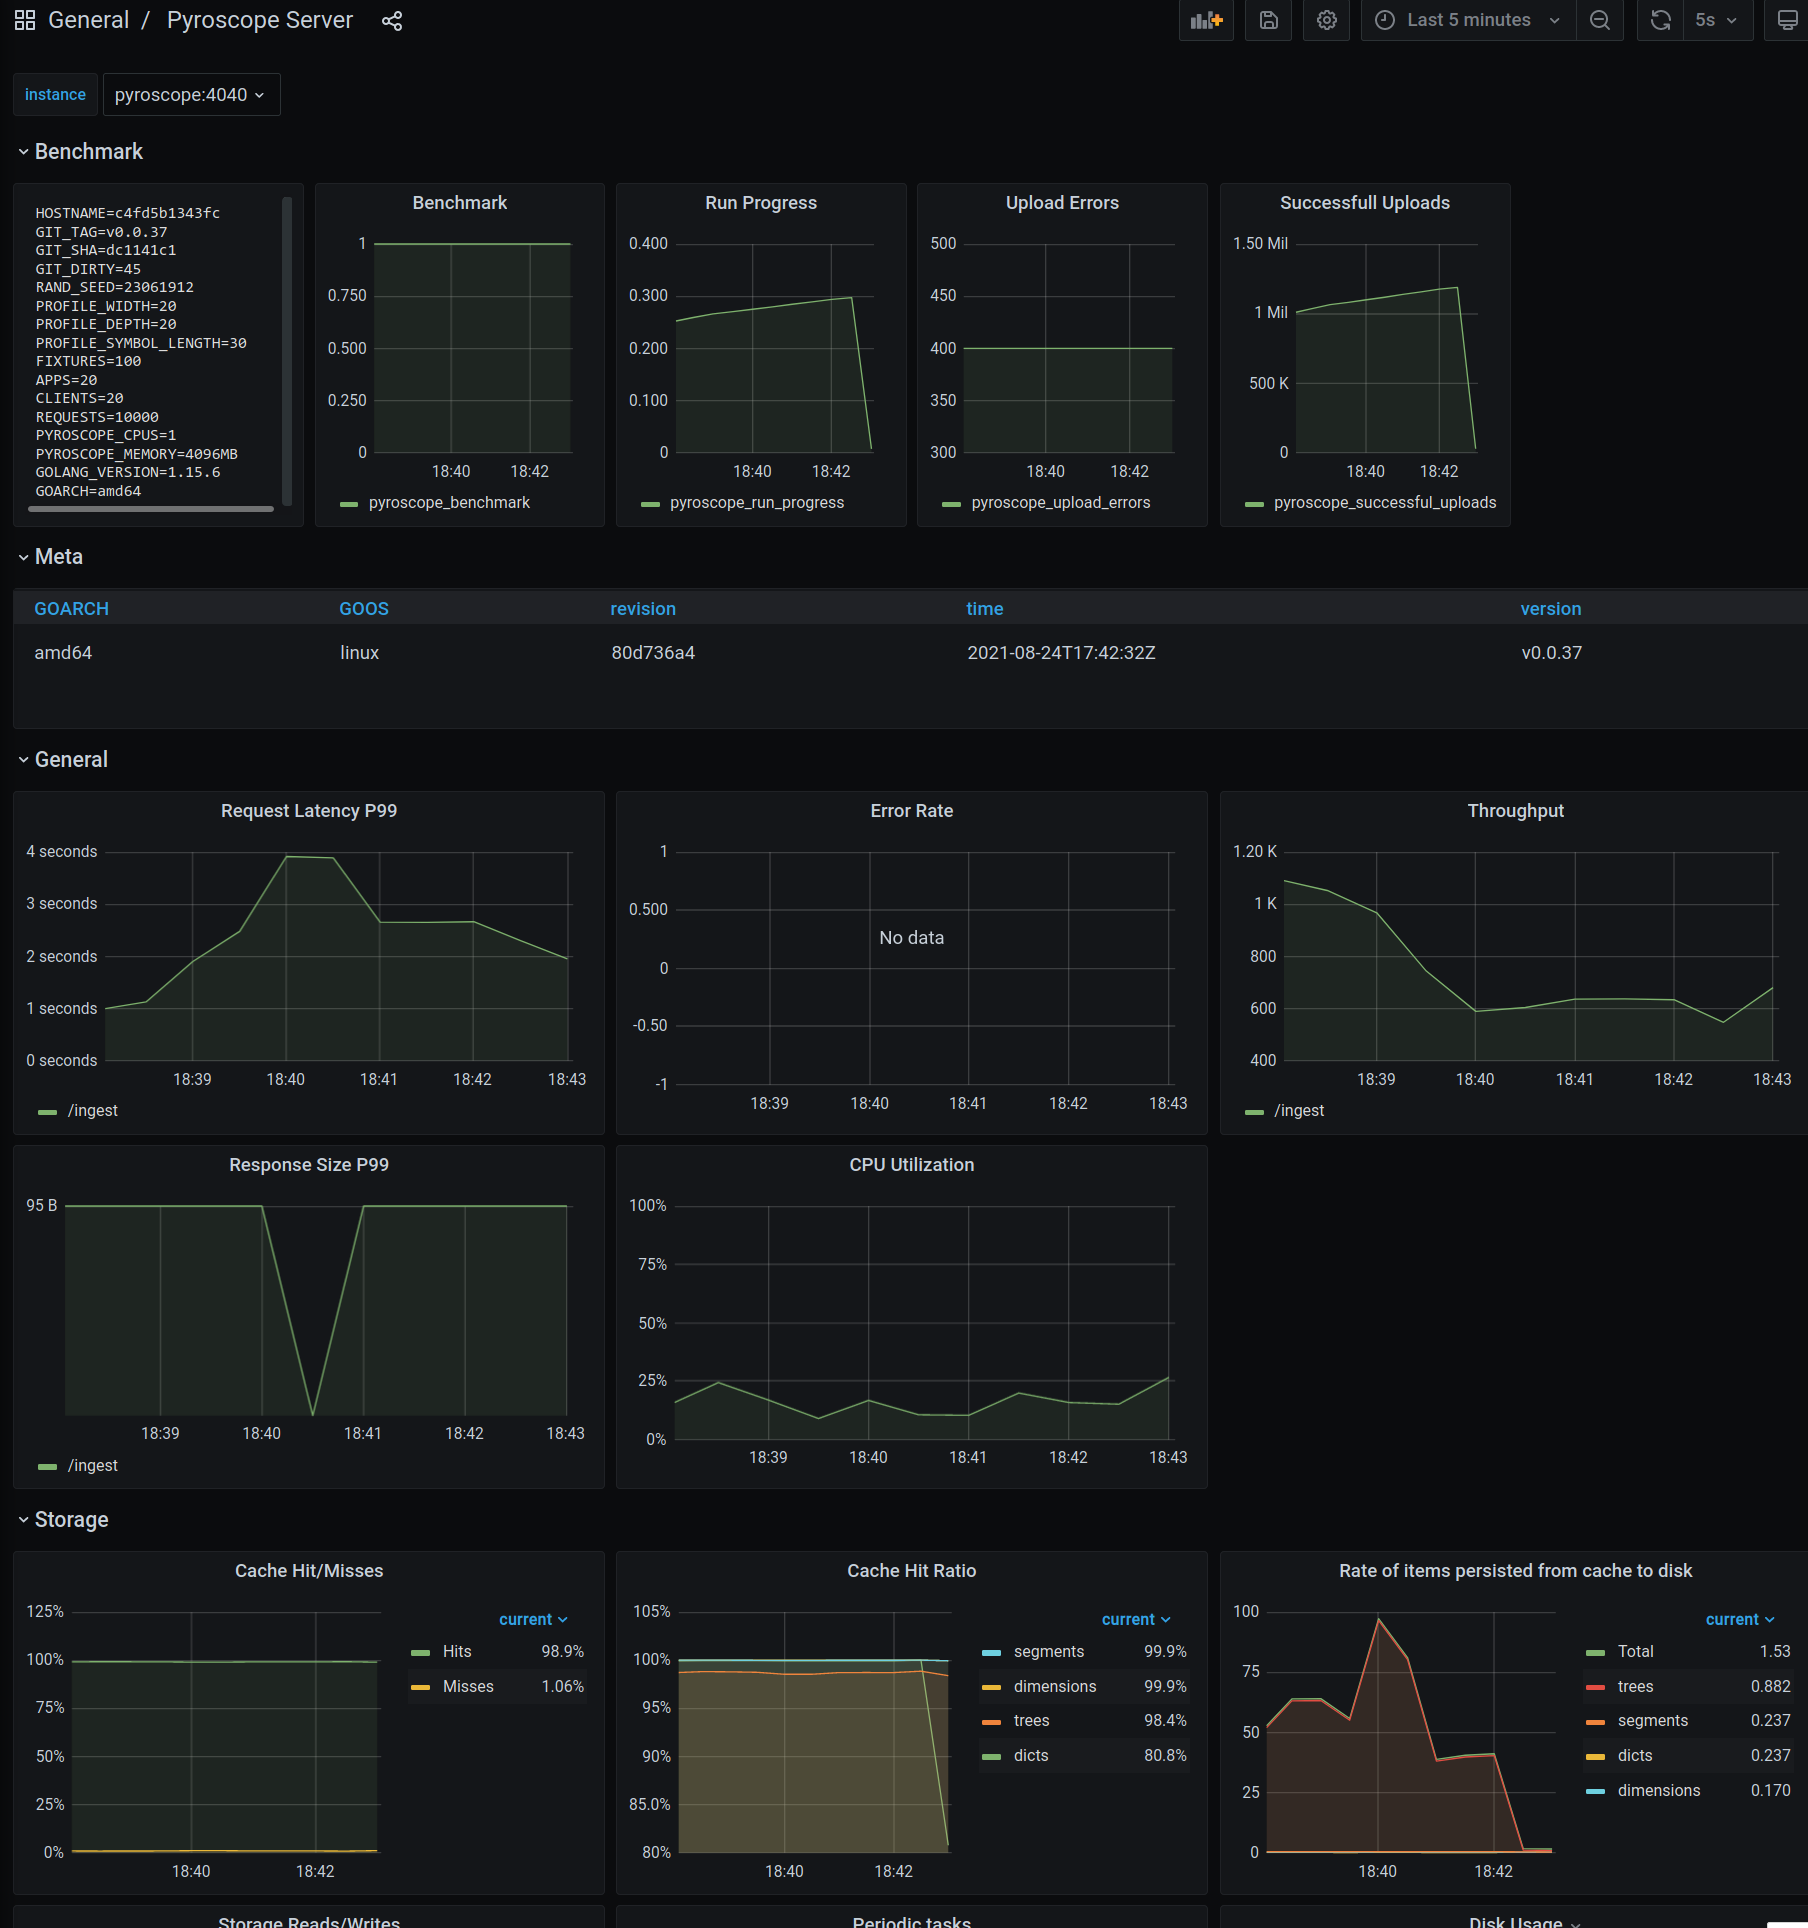
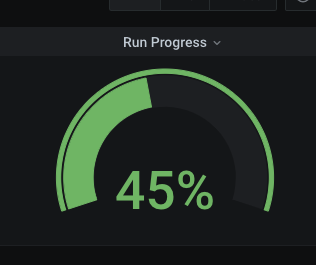
The only difference so far is an additional row at the top with benchmark metrics:
Screenshot from 2021-08-24 18-43-08

Plus updates examples/grafana-integration, although it's not currently functional, since it refers to the pyroscope:latest docker image, which doesn't contain the new metric names yet.

@petethepig
Copy link
Collaborator

petethepig commented Aug 24, 2021

@eh-am Looks good, I have 3 comments:

  • Could you make the run progress be a gauge?
    Screen Shot 2021-08-24 at 3 29 39 PM
  • what is pyroscope_benchmark metric? Second panel in the first row
  • the first panel in the first raw was my hacky attempt at implementing the table you have in the second row. If it's not too hard it would be nice to just add all those things from the text panel to the table.

@codecov
Copy link

codecov bot commented Aug 24, 2021

Codecov Report

Merging #349 (074e72c) into main (de87046) will not change coverage.
The diff coverage is n/a.

Impacted file tree graph

@@           Coverage Diff           @@
##             main     #349   +/-   ##
=======================================
  Coverage   54.32%   54.32%           
=======================================
  Files         102      102           
  Lines        5013     5013           
=======================================
  Hits         2723     2723           
  Misses       2041     2041           
  Partials      249      249           

Continue to review full report at Codecov.

Legend - Click here to learn more
Δ = absolute <relative> (impact), ø = not affected, ? = missing data
Powered by Codecov. Last update de87046...074e72c. Read the comment docs.

@eh-am
Copy link
Collaborator Author

eh-am commented Aug 25, 2021

Could you make the run progress be a gauge?

Done.

what is pyroscope_benchmark metric? Second panel in the first row

It's just an indication that the client has started, but yeah it's bit redundant given that we have the progress metric too. Removed it.

the first panel in the first raw was my hacky attempt at implementing the table you have in the second row. If it's not too hard it would be nice to just add all those things from the text panel to the table.

Ah it's not that hacky, I think it works pretty well. Honestly there are many columns which don't work well with an horizontal table, and having a vertical table seems non trivial (grafana/grafana#36973). So I left as it it's.
Screenshot from 2021-08-25 14-49-41

Copy link
Collaborator

@petethepig petethepig left a comment

Choose a reason for hiding this comment

The reason will be displayed to describe this comment to others. Learn more.

LGTM

@petethepig petethepig merged commit 1e1267a into main Aug 25, 2021
@petethepig petethepig deleted the benchmark-dashboard branch August 25, 2021 18:10
korniltsev pushed a commit that referenced this pull request Jul 18, 2023
Sign up for free to join this conversation on GitHub. Already have an account? Sign in to comment
Labels
None yet
Projects
None yet
Development

Successfully merging this pull request may close these issues.

2 participants