A Python extension for Gloodata that provides advanced business analytics and dashboards using the Oracle Sample Schemas SH (Sales History) database for comprehensive sales analysis and reporting.
-
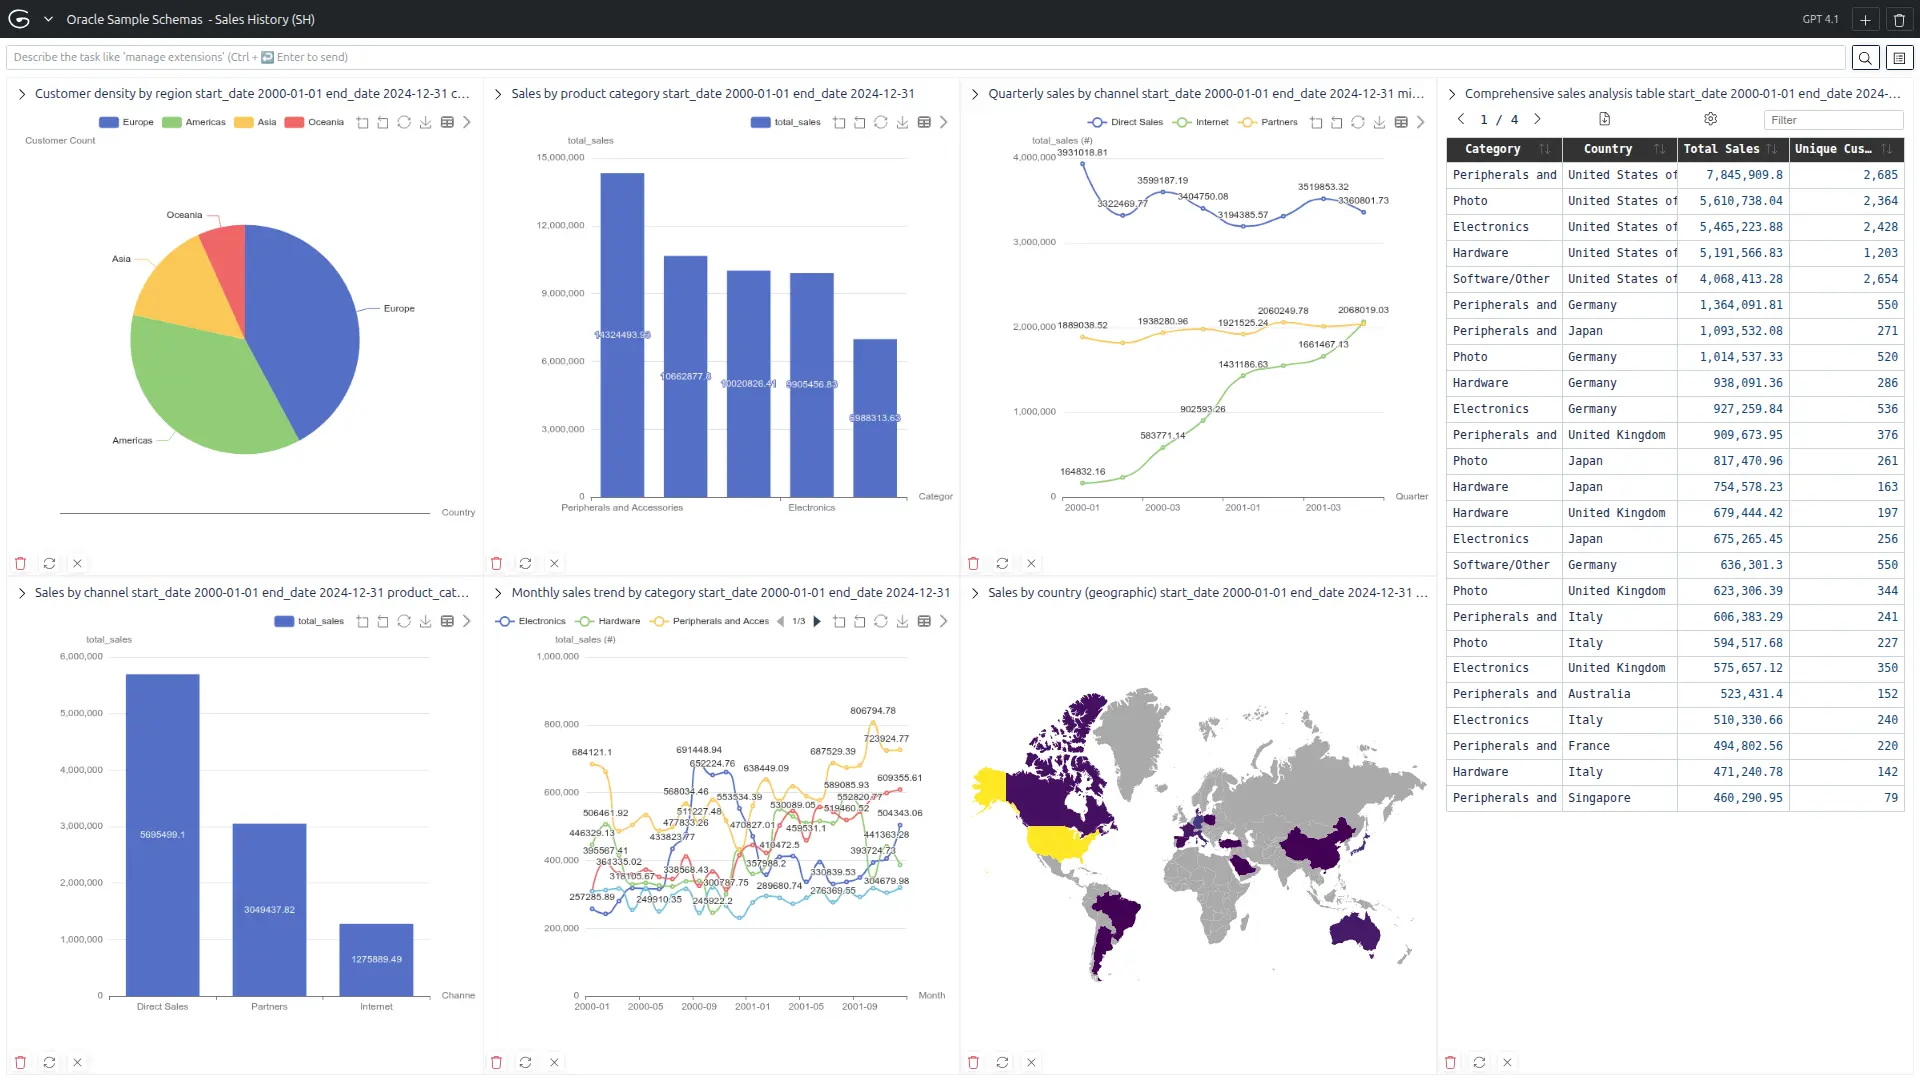
📊 Analytics Tools
-
Sales by Product Category Analysis Bar chart showing sales performance by product category. Total sales and quantity analysis with filtering capabilities.
-
Sales by Channel Analysis Channel performance comparison and revenue distribution. Support for customer segment filtering.
-
Customer Geography Analysis Geographic distribution and regional performance mapping. Customer density visualization by region.
-
Monthly Sales Trend Analysis Time-series analysis showing sales trends by category over time.
-
Quarterly Sales Performance Quarterly sales analysis by channel with trend visualization.
-
Comprehensive Sales Analysis Detailed sales metrics table with multiple dimensions.
-
Geographic Sales Mapping World map visualization of sales performance by country.
-
-
🎯 Smart Filtering System Each function supports multiple filters for dynamic analysis:
- Date ranges for time-based analysis
- Geographic filters (country/region)
- Product category filters for focused analysis
- Customer segment filters for targeted insights
- Channel filters for sales performance tracking
- Minimum amount filters for threshold analysis
-
📈 Diverse Visualization Types
- Bar charts for comparisons
- Line charts for trends
- Pie charts for distributions
- Area maps for geographic data
- Tables for detailed data exploration
- Series charts for multi-dimensional analysis
-
🔍 Business Intelligence Focus The queries answer critical business questions like:
- Which product categories drive the most revenue?
- What are our sales trends by channel?
- How are customers distributed geographically?
- What are our seasonal sales patterns?
- Which countries generate the highest sales?
- How do different customer segments perform?
- What are our quarterly performance trends?
Check that you are in a recent version of uv:
uv self update-
Clone the repository:
git clone https://github.com/gloodata/extension-oracle-sample-schemas.git cd extension-oracle-sample-schemas -
Install Oracle Sample Schemas You need to have Oracle Database installed and running with the SH (Sales History) sample schema. Follow the official Oracle documentation to install the sample schemas:
-
Configure Oracle connection: Update the
config.tomlfile with your Oracle database connection details:[oracle] username = username password = password wallet_path = /opt/oracle/wallet wallet_password = password dsn = (description=(retry_count=20)(retry_delay=3)(address=(protocol=tcps)(port=1522)(host=adb.eu-frankfurt-1.oraclecloud.com))(connect_data=(service_name=ge00000000000ce_gloodata_high.adb.oraclecloud.com))(security=(ssl_server_dn_match=yes))) schema = SH
-
Run the extension:
uv run src/main.py --host 127.0.0.1 --port 8885
Bar chart showing total sales performance by product category.
- "Sales by product category"
- "Revenue by category"
- "Category performance analysis"
Tool: sales_by_category
Query: sales_by_category
Chart: bar
Channel performance comparison showing revenue distribution across different sales channels.
- "Sales by channel"
- "Channel performance"
- "Revenue by sales channel"
Tool: sales_by_channel
Query: sales_by_channel
Chart: bar
Geographic analysis showing customer distribution and density by region.
- "Customer density by region"
- "Customer geographic distribution"
- "Regional customer analysis"
Tool: customer_density
Query: customer_density
Chart: pie
Time-series analysis showing monthly sales trends by product category.
- "Monthly sales trend by category"
- "Sales trends over time"
- "Monthly category performance"
Tool: monthly_sales_trend
Query: monthly_sales_trend
Chart: line (series chart)
Quarterly performance analysis showing sales trends by channel over time.
- "Quarterly sales by channel"
- "Quarterly channel performance"
- "Channel trends by quarter"
Tool: quarterly_sales_by_channel
Query: quarterly_sales_by_channel
Chart: line (series chart)
Detailed sales metrics table with multiple dimensions for in-depth analysis.
- "Comprehensive sales analysis"
- "Detailed sales metrics"
- "Sales analysis table"
Tool: sales_analysis
Query: sales_analysis
Chart: table
World map visualization showing sales performance by country.
- "Sales by country"
- "Geographic sales performance"
- "World sales map"
Tool: sales_by_country
Query: sales_by_country
Chart: areamap with map world
Files you may want to check first:
extension-oracle-sample-schemas/
├── src/
│   ├── toolbox.py          # Main extension logic
│   ├── state.py            # Database connection and state management
│   └── main.py             # Extension entry point
│   └── oracle.py           # Oracle connection and query runner
├── queries.sql             # SQL queries for analytics
├── config.toml             # Database configuration
└── resources/              # Images and static assets
- Define new SQL queries in
queries.sql - Create tool functions in
src/toolbox.pyusing the@tb.tooldecorator - Specify visualization types and parameters in the return dictionary
- Add appropriate enum filters if needed
The extension provides several dynamic enums for filtering:
- Country: Filter by country/region
- ProductCategory: Filter by product category
- Channel: Filter by sales channel
- CustomerSegment: Filter by customer segment
- Python
- Oracle Database
- Oracle SH Sample Schema
- uv
- Oracle Sample Schemas - SH (Sales History)
- Contains historical sales data with multiple dimensions including:
- Product categories and subcategories
- Customer information and segments
- Geographic data (countries, regions)
- Sales channels
- Time dimensions (monthly, quarterly)
This project is open source and available under the MIT License.
For questions, issues, or contributions, please open an issue on GitHub or contact the maintainers.
The SH schema includes the following key tables used by this extension:
- SALES: Main sales fact table containing transactional sales data
- CUSTOMERS: Customer dimension with customer information and segments
- PRODUCTS: Product dimension with categories and product details
- TIMES: Time dimension for temporal analysis (monthly, quarterly, yearly)
- CHANNELS: Sales channel dimension defining different sales channels
- COUNTRIES: Geographic dimension with country and region information
- COSTS: Cost information table for profitability analysis
- PROMOTIONS: Promotional campaigns and discount information
- SUPPLEMENTARY_DEMOGRAPHICS: Additional demographic data for enhanced customer analysis
For more information about the SH schema structure, refer to the Oracle Sample Schemas documentation.