It is an expression-based quality control tool to detect outliers either produced by batch effects or merely due to dissimilarity within a phenotypic group. It can be utilized by three ways:
iSeqQC is readily available at:
http://cancerwebpa.jefferson.edu/iSeqQC/
Running iSeqQC locally requires:
- Local installation of R or RStudio (version 3.5 or later)- if not available use https://cran.r-project.org/ to download.
- Installation of bioconductor packages using following commands:
if (!requireNamespace("BiocManager", quietly = TRUE))
install.packages("BiocManager")
BiocManager::install()
BiocManager::install(c("shiny", "FactoMineR", "factoextra", "som", "psych", "data.table", "ape", "corrplot", "limma", "DESeq2"))
- After successfully installing R/RStudio and related packages, iSeqQC can simply be run from 'iSeqQC_cli' directory using following command:
Rscript --vanilla iSeqQC_cli/iSeqQC.R exampleData/samplemanifestfile.txt {sample_phenotype_file} exampleData/genesymbol_rawcounts.txt {count_matrix} R {type_of_reads} SYMBOL {type_of_gene_identifier} H {Organism}
where,
type_of_reads: R for raw reads and N for normalized reads
type_of_gene_identifier: SYMBOL if count matrix has gene_symbols in first column and ID if it has gene_ids
Organism: H for Human, M for Mouse and O for others
Running iSeqQC locally requires:
- Local installation of R or RStudio (version 3.5 or later)- if not available use https://cran.r-project.org/ to download.
- Installation of bioconductor packages using following commands:
if (!requireNamespace("BiocManager", quietly = TRUE))
install.packages("BiocManager")
BiocManager::install()
BiocManager::install(c("shiny", "FactoMineR", "factoextra", "som", "psych", "data.table", "ape", "corrplot", "limma", "DESeq2"))
- After successfully installing R/RStudio and related packages, iSeqQC can simply be run using following commands in R console:
setwd("path_to_local_iSeqQC_installation_directory")
library("shiny")
runApp("iSeqQC")
Please note: iSeqQC shiny installations are successful tested on safari v-12.1, chrome v-79.0, and firefox v-72.2. However, we recommend google chrome for optimum usage.
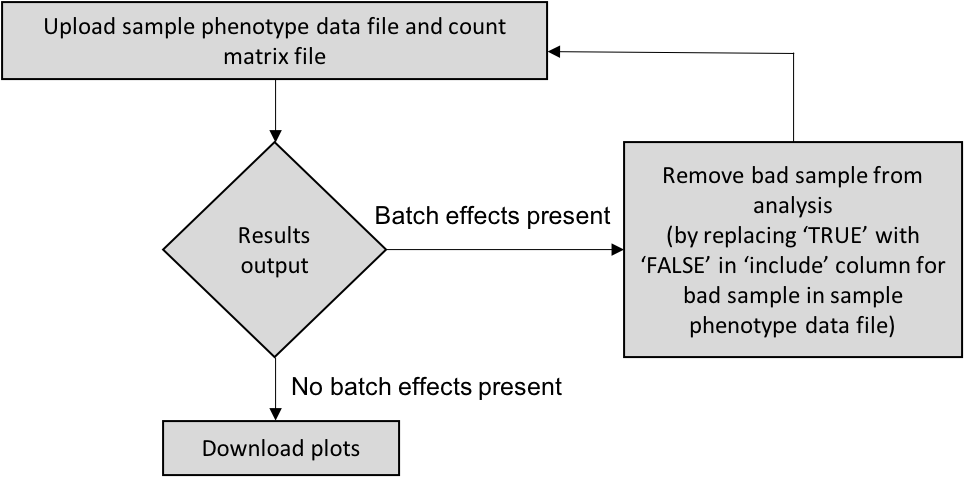
iSeqQC requires two files for the analysis. Both files should be ASCII formatted tab-delimited file only
- File 1- Sample phenotype data: First 4 columns should strictly match the names and order as mentioned below (names case-sensitive)
Sample names in first column 'samples' should match the names in counts matrix file
column 1: samples
column 2: shortnames
column 3: groups
column 4: include
column 5-11: any factors such as library method, protocol etc.
Example:
| samples | shortnames | groups | include |
|---|---|---|---|
| Control_1 | C_1 | control | TRUE |
| Control_2 | C_2 | control | TRUE |
| Control_3 | C_3 | control | TRUE |
| Treated_1 | T_1 | treated | TRUE |
| Treated_2 | T_2 | treated | TRUE |
| Treated_3 | T_3 | treated | TRUE |
- File 2- counts matrix file: First column of this file should have official gene symbols or gene ids under the name "gene"(case-sensitive)
Example:
| gene_symbol | Control_1 | Control_2 | Control_3 | Treated_1 | Treated_2 | Treated_3 |
|---|---|---|---|---|---|---|
| TSPAN6 | 642 | 329 | 704 | 507 | 524 | 629 |
| DPM1 | 1443 | 734 | 1502 | 1175 | 1543 | 1111 |
or
| gene_id | Control_1 | Control_2 | Control_3 | Treated_1 | Treated_2 | Treated_3 |
|---|---|---|---|---|---|---|
| ENSG00000000003 | 642 | 329 | 704 | 507 | 524 | 629 |
| ENSG00000000005 | 1443 | 734 | 1502 | 1175 | 1543 | 1111 |
iSeqQC displays the results in a form of a summary table and several plots: Summary statistics, counts distribution, Mapped read density, Housekeeping gene expression, Principal Component variances (zscored normalized), Principal Component variances (un-normalized), Hierarchical relationship between samples, Pearson correlation, Spearman correlation, GC bias)
Kumar G, Ertel A, Feldman G, Kupper J, Fortina P (2020). iSeqQC: A Tool for Expression-Based Quality Control in RNA Sequencing. BMC Bioinformatics. Feb 13;21(1):56. doi: 10.1186/s12859-020-3399-8. PMID: 32054449; PMCID: PMC7020508