Docs | Examples | GitHub | Changelog | #visualization on Elm slack
This project is designed to give you all the tools needed to build data visualizations. It is not a charting library in the sense that you have pre-bundled Excel-style charts, but it should contain all the tools to make building such charts relatively easy. The advantage is that you are free to design and build data visualizations that uniquely suite your needs.
Learn by example
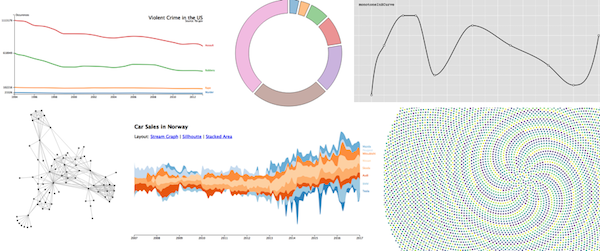
Most of the time you have data that has properties that you want to display on the screen, however these properties typically aren't in pixels. Scales solve this fundamental problem by giving you convenient ways to transform raw data into positions, sizes, colors, labels and other ways to display data.
A component that allows you to visualize a Scale. Those little ticks that describe the dimensions of a plot.
This module gives you ways to draw some fundamental shapes used in data visualization, including lines (as in line or area charts), as well as arcs (as in pie charts).
Use a simulation of physical forces to do layout. Suitable for i.e. network graphs.
Smoothly transition between pairs of values. Useful for animation, or generating gradients of values.
Build complex animations using Interpolation.
Compute histograms of data.
Build pan and zoom user interactions.
Process data to extract useful insights for visualizations.
Heavily inspired by parts of the D3 library by Mike Bostock. However since Elm provides a great DOM abstraction already, selections are not part of this library.
This library is still under active development, so please submit feature requests iff you are also willing to implement them. Bug reports are welcome.