This repository aims to resolve the code challenge proposed by the DTB Tech/Data Tech Hub.
- Getting started
- Schemas and conventions
- The technology stack
- The data classification
- Final considerations
First of all, you will need to create your configuration file by copying the app.cfg.example as app.cfg
(a normal cp app.cfg.example app.cfg would do it).
In case of production don't forget to change the MAX_FILES_PER_TRIGGER setting, otherwise the stream will seem slower than it is.
Fill all the values with your preferred configurations. Special attention to the TimescaleDB section, if you are running
this project with Docker, then it will connect from the Spark container to the TimescaleDB container.
In this case, the host part of it have to be configured accordingly with your Docker local IP (if running on Docker).
To discover the Docker local ip of your TimescaleDB container you should use:
docker inspect --format '{{ .NetworkSettings.IPAddress }}' <container id or name>
After properly configuration of the app.cfg file, you have to create the table of the TimescaleDB by running: python recreate_tables.py.
Again, if using Docker this command shall be runned on the Spark container.
Finally we're good to go. We have two main entry points for this project:
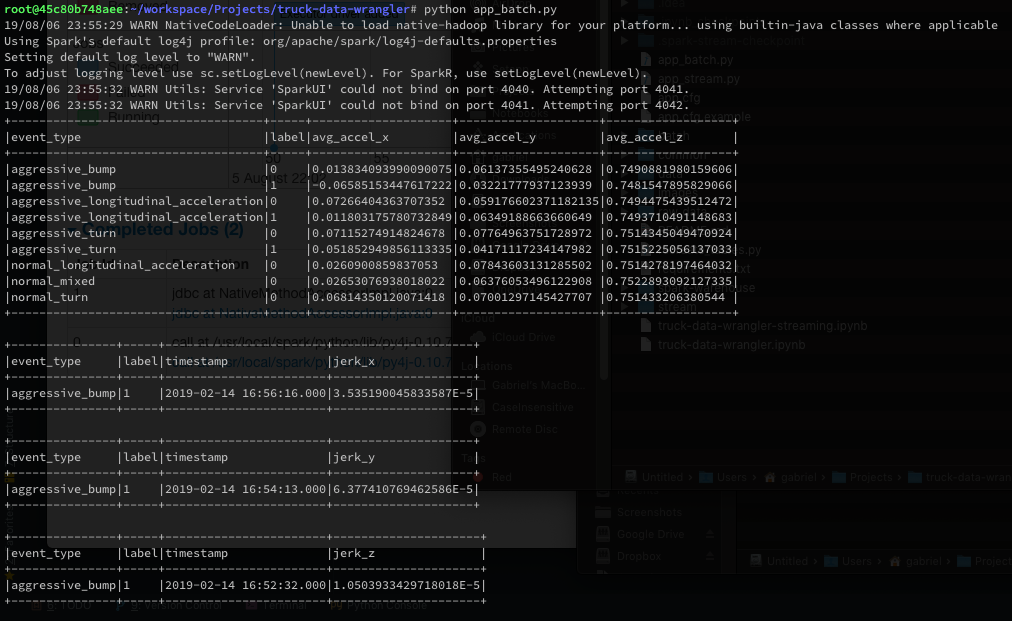
python app_batch.pywill process all the raw_data and give us:- The mean acceleration per event type and label
- The maximum jerk timestamp on human readable date time stamp
python app_stream.pywill watch the folder raw_data or an S3 bucket folder or even an HDFS folder, every 10 seconds (or less or more - configurable) will search for new files, stream it to Spark and do an upsert to our TimescaleDB:- More specifically on a table called
jerked_truck_events. In that table we also have 4 new binary flags:is_accelerating,is_breaking,is_turning_left,is_turning_right
- More specifically on a table called
We have tests for the three modules, to run just do as follows:
python tests/test_common.pypython tests/test_batch.pypython tests/test_stream.py
Important notes about the tests:
- All sql queries inside
common/sql_queries.pyare syntax checked by thetest_commonsuite; - Both batch and stream ETL pipelines are tested against a downsized dataset located inside
tests/raw_data_testfolder - When testing the stream, the test suite will try to connect to your TimescaleDB and create a database exclusively for testing (the name will be your configured database name with a
_testsuffix)- If the TimescaleDB connection user don't have grants to create a new database, this test suite will fail.
Before diving into some why & how of this project, we need to set our file name conventions, CSV schema and of course the Database schema too.
Each CSV file needs to have the name with the event type prefix and the timestamp in the suffix, resulting in this pattern: {event_type}_{timestamp}.csv. Example: normal_mixed_1549901031015048.csv.
Each CSV file needs its columns in the order described in the table below. Otherwise the stream will fail to parse and send it to the database. Important to mention that we had one file with an extra column before the blank column. This file was pre processed and saved with the same columns of the other files.
| Column name | Can be null? | Type |
|---|---|---|
| blank | Yes | Integer |
timestamp |
No | Big integer - microsecond timestamp |
accel_x |
No | Numeric |
accel_y |
No | Numeric |
accel_z |
No | Numeric |
gyro_roll |
No | Numeric |
gyro_pitch |
No | Numeric |
gyro_yaw |
No | Numeric |
label |
No | String |
Primary keys: date_timestamp, event_type, label
| Column | Type | Description |
|---|---|---|
date_timestamp |
TIMESTAMP NOT NULL |
The timestamp of the record |
label |
VARCHAR(50) NOT NULL |
The label string the categorizes the values series |
event_type |
VARCHAR(255) NOT NULL |
The event type (this one comes from the file name convention) |
accel_x |
DECIMAL(40, 20) |
The accelerometer X-axis value |
accel_y |
DECIMAL(40, 20) |
The accelerometer Y-axis value |
accel_z |
DECIMAL(40, 20) |
The accelerometer Z-axis value |
gyro_roll |
DECIMAL(40, 20) |
The gyroscope Roll-axis value |
gyro_pitch |
DECIMAL(40, 20) |
The gyroscope Pitch-axis value |
gyro_yaw |
DECIMAL(40, 20) |
The gyroscope Yaw-axis value |
last_timestamp |
BIGINT |
The last timestamp in microsecond before this registry |
last_accel_x |
DECIMAL(40, 20) |
The last accelerometer X-axis value before this registry |
last_accel_y |
DECIMAL(40, 20) |
The last accelerometer Y-axis value before this registry |
last_accel_z |
DECIMAL(40, 20) |
The last accelerometer Z-axis value before this registry |
jerk_x |
DECIMAL(40, 20) |
The Jerk variation of the accelerometer X-axis |
jerk_y |
DECIMAL(40, 20) |
The Jerk variation of the accelerometer Y-axis |
jerk_z |
DECIMAL(40, 20) |
The Jerk variation of the accelerometer Z-axis |
is_accelerating |
INTEGER |
The binary classification if in this given point the truck was accelerating (0 = No, 1 = Yes) |
is_breaking |
INTEGER |
The binary classification if in this given point the truck was breaking (0 = No, 1 = Yes) |
is_turning_left |
INTEGER |
The binary classification if in this given point the truck was turning left (0 = No, 1 = Yes) |
is_turning_right |
INTEGER |
The binary classification if in this given point the truck was turning right (0 = No, 1 = Yes) |
- TimescaleDB (PostgreSQL fine tuned for "real-time" applications with high-frequency INSERT statements)
- Apache Spark (with Structured Streaming)
Assuming we have several trucks to monitor on, it would be very practical, secure and easy to just upload a csv with the sensors values of each truck inside a folder (on S3 or HDFS), and automatically this file would be parsed by our Structured Streaming ETL and get inserted right into the TimescaleDB. This way we have an scalable storage solution integrated into an scalable pipeline with Spark. Giving us the possibility to even run this on Amazon Web Service EMR.
The ideal data classification here, would be using a filter to wipe some noisy high frequencies that came with the sensors values. Altought I decided to focus more on the scalable part of this project than on the algorithmic part itself. The algorithm used to classify this data can be improved throughout the time.
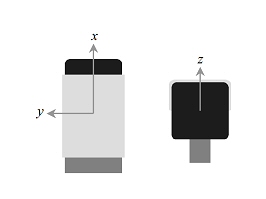
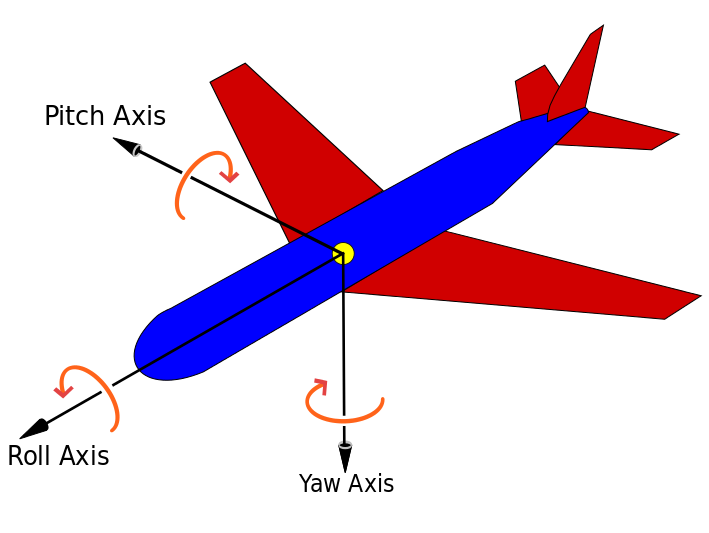
As little information that was given about the sensors, we assumed several conditions that has to be illustrated here (please, don't mind the airplane on the picture, its for illustration purposes):
| Accelerometer sensor schema | Gyroscope sensor schema |
|---|---|
 |
 |
To classify if the truck was accelerating and breaking we simply check if the Jerk of the X value of the accelerometer is positive or negative. The Jerk is the variation rate of the accelerometer value. If it is positive, then the truck is accelerating. If it is negative, then the truck is breaking.
And lastly, but not leastly, to check if the truck was turning right or left we assumed the Yaw angle was accounted from left to right. With that in mind, to classify a turn we check if the gyroscope yaw value was outside the standard deviation mod window. Example: if the std.d. was 0.2, then if the yaw value is between -0.2 to 0.2 we assume the truck is steady and straight forward. But if it was below -0.2, then we assume the truck was turning left. And finally if it was higher than 0.2, then we assume the truck was turning right.
This project's simplistic algorithm to classify the flags may cause some trouble to later reuse it. On the other hand, using something like S3 and a database that uses PostgreSQL Connector makes this application a breeze to integrate it in a larger system nor scale it to a larger dataset.
Suggestion: Plug Grafana dashboard into the TimescaleDB to create a fancy real-time updated dashboard of trucks events.

