[ML] Redesign file-based Data Visualizer #87598
Conversation
…agrid, update mappings
x-pack/test/functional/apps/ml/data_visualizer/files_to_import/artificial_server_log
Show resolved
Hide resolved
 pheyos
left a comment
pheyos
left a comment
There was a problem hiding this comment.
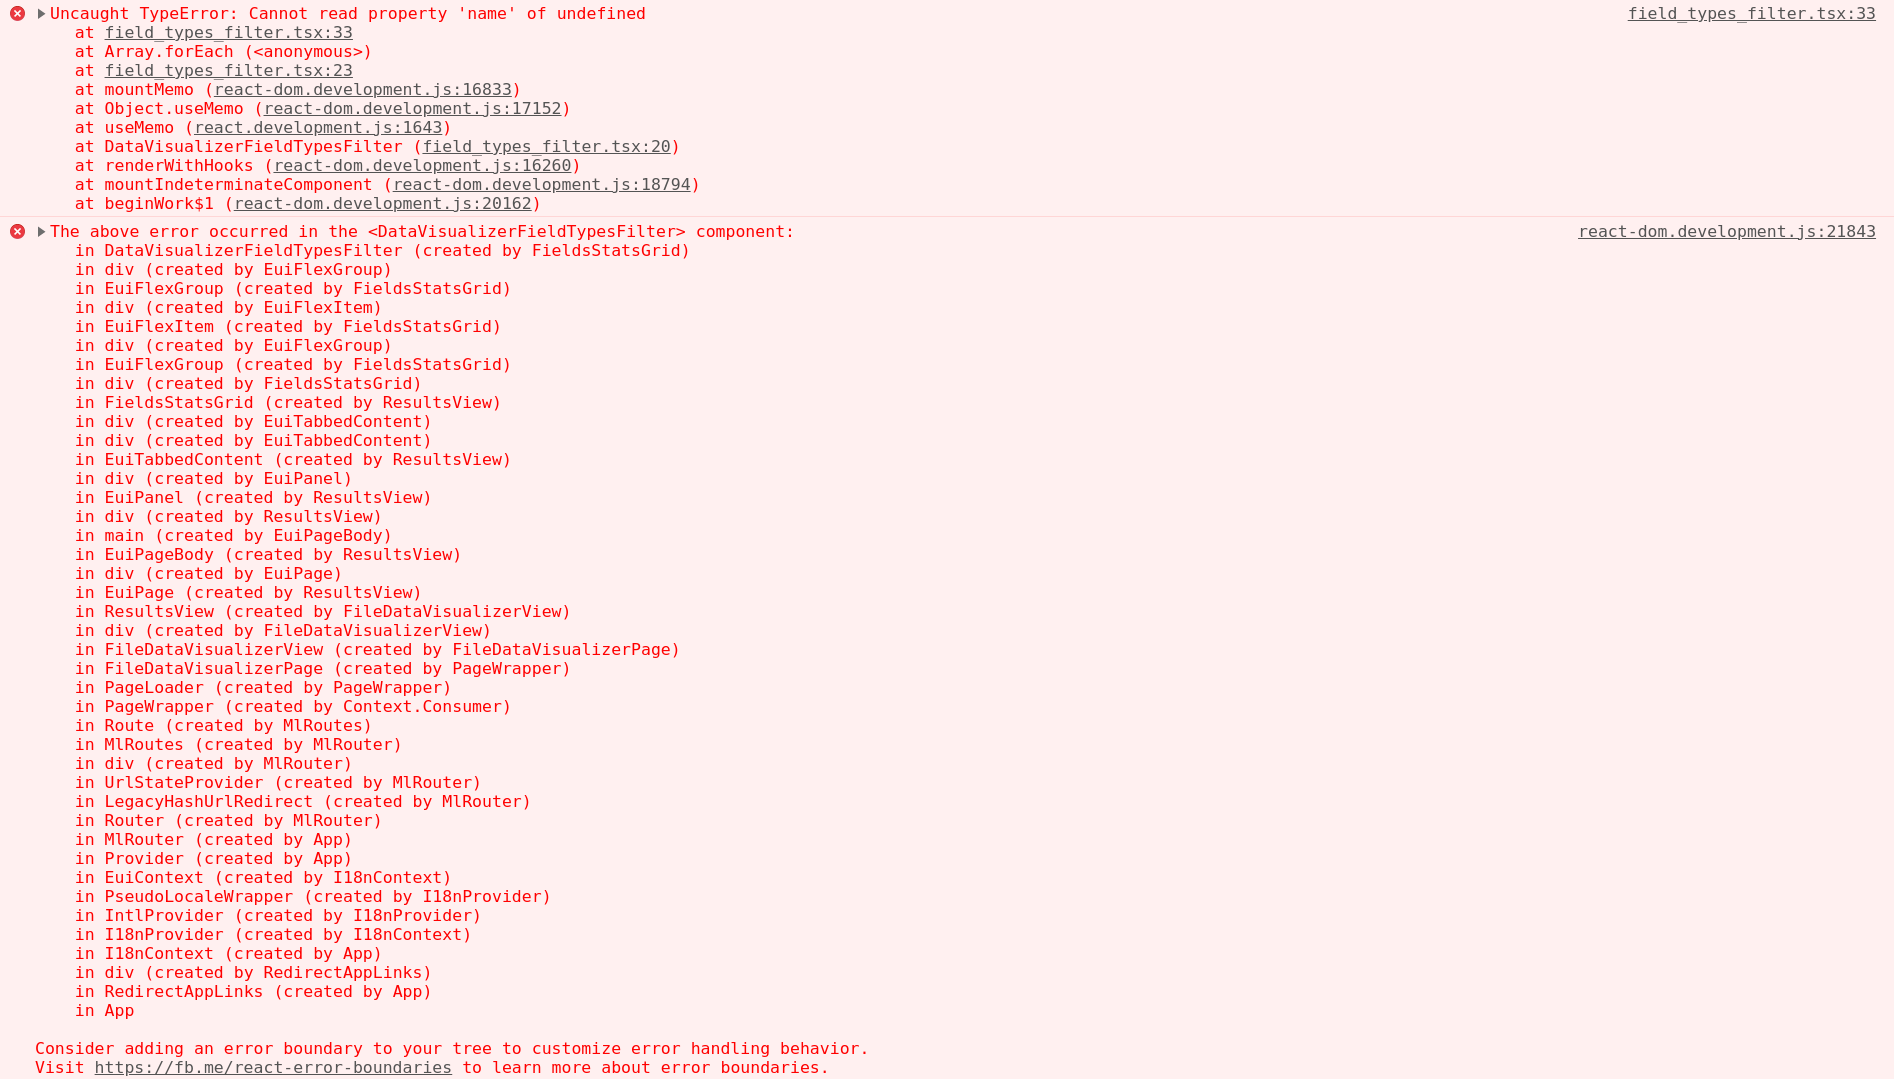
One of my test files (ts_head.log) crashes the ML app on data visualizer load (blank page, have to switch to a different Kibana app and come back to ML again). The console shows the following error:
 mdefazio
left a comment
mdefazio
left a comment
There was a problem hiding this comment.
I think this is quite close! Just a few comments:
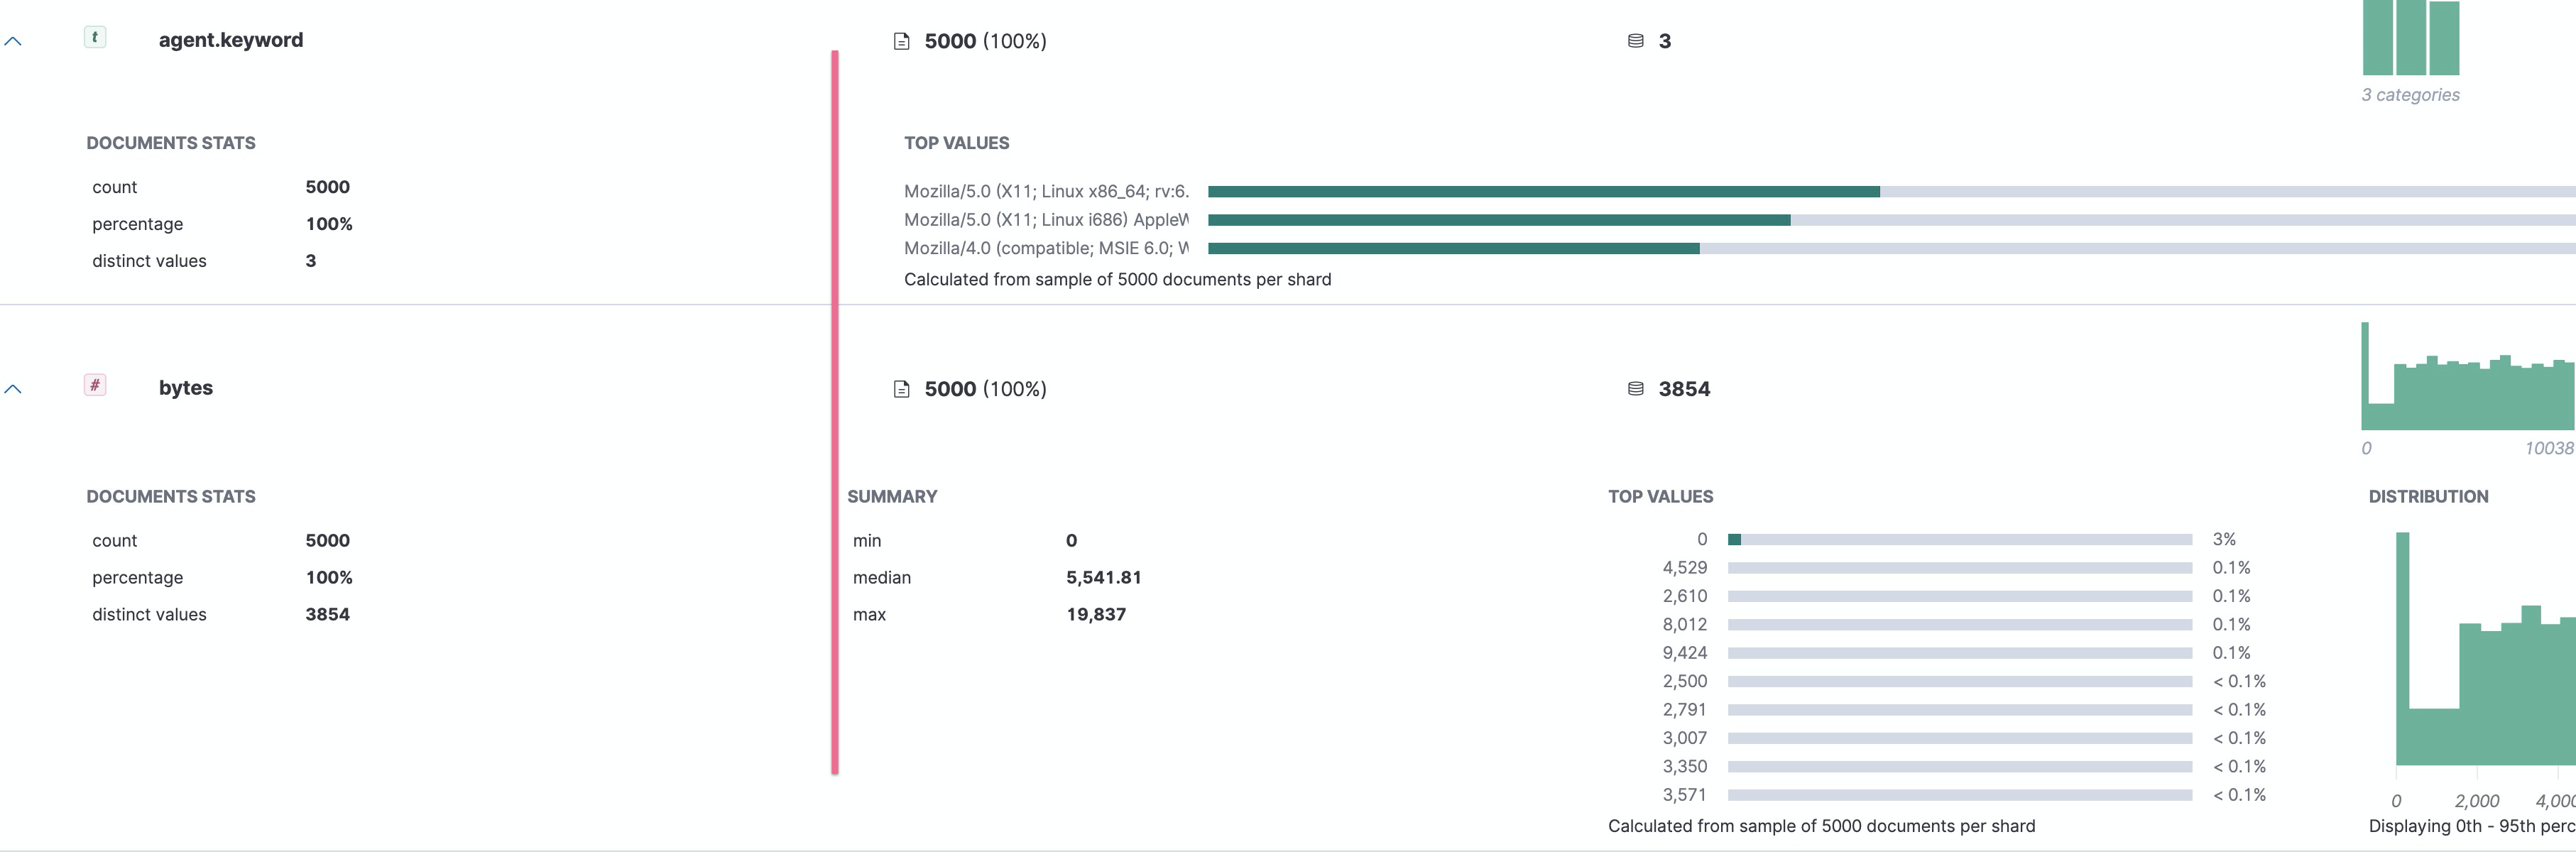
- It looks like we have different gutter sizes set on the flex group for the expanded row depending on the field type.
Keyword:
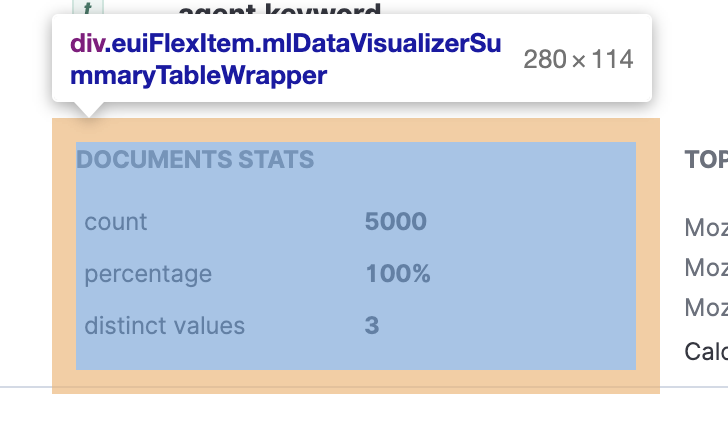
Number:

- It might be nice to force the stats table to have a max-width and then the subsequent columns will start at the same point
With a width set (instead of a percent value for the columns).

|
Thanks @mdefazio I have updated the gutter size to all match in the latest changes as well as having a fixed pixel number for the |
 peteharverson
left a comment
peteharverson
left a comment
There was a problem hiding this comment.
Tested latest edits and LGTM
| import type { PartialTheme } from '@elastic/charts'; | ||
| import { useUiSettings } from '../../../contexts/kibana'; | ||
| export const useDataVizChartTheme = (): PartialTheme => { | ||
| const isDarkTheme = useUiSettings().get('theme:darkMode'); |
There was a problem hiding this comment.
To be using useUiSettings in a hook like this, shouldn't it be watching for changes in the settings?
Like this function:
Otherwise it doesn't need to be in a hook.
There was a problem hiding this comment.
You're right. This is now updated here e09dc6f
mdefazio
left a comment
There was a problem hiding this comment.
Tested locally and this all looks good.
💚 Build SucceededMetrics [docs]Module Count
Async chunks
History
To update your PR or re-run it, just comment with: |
Summary
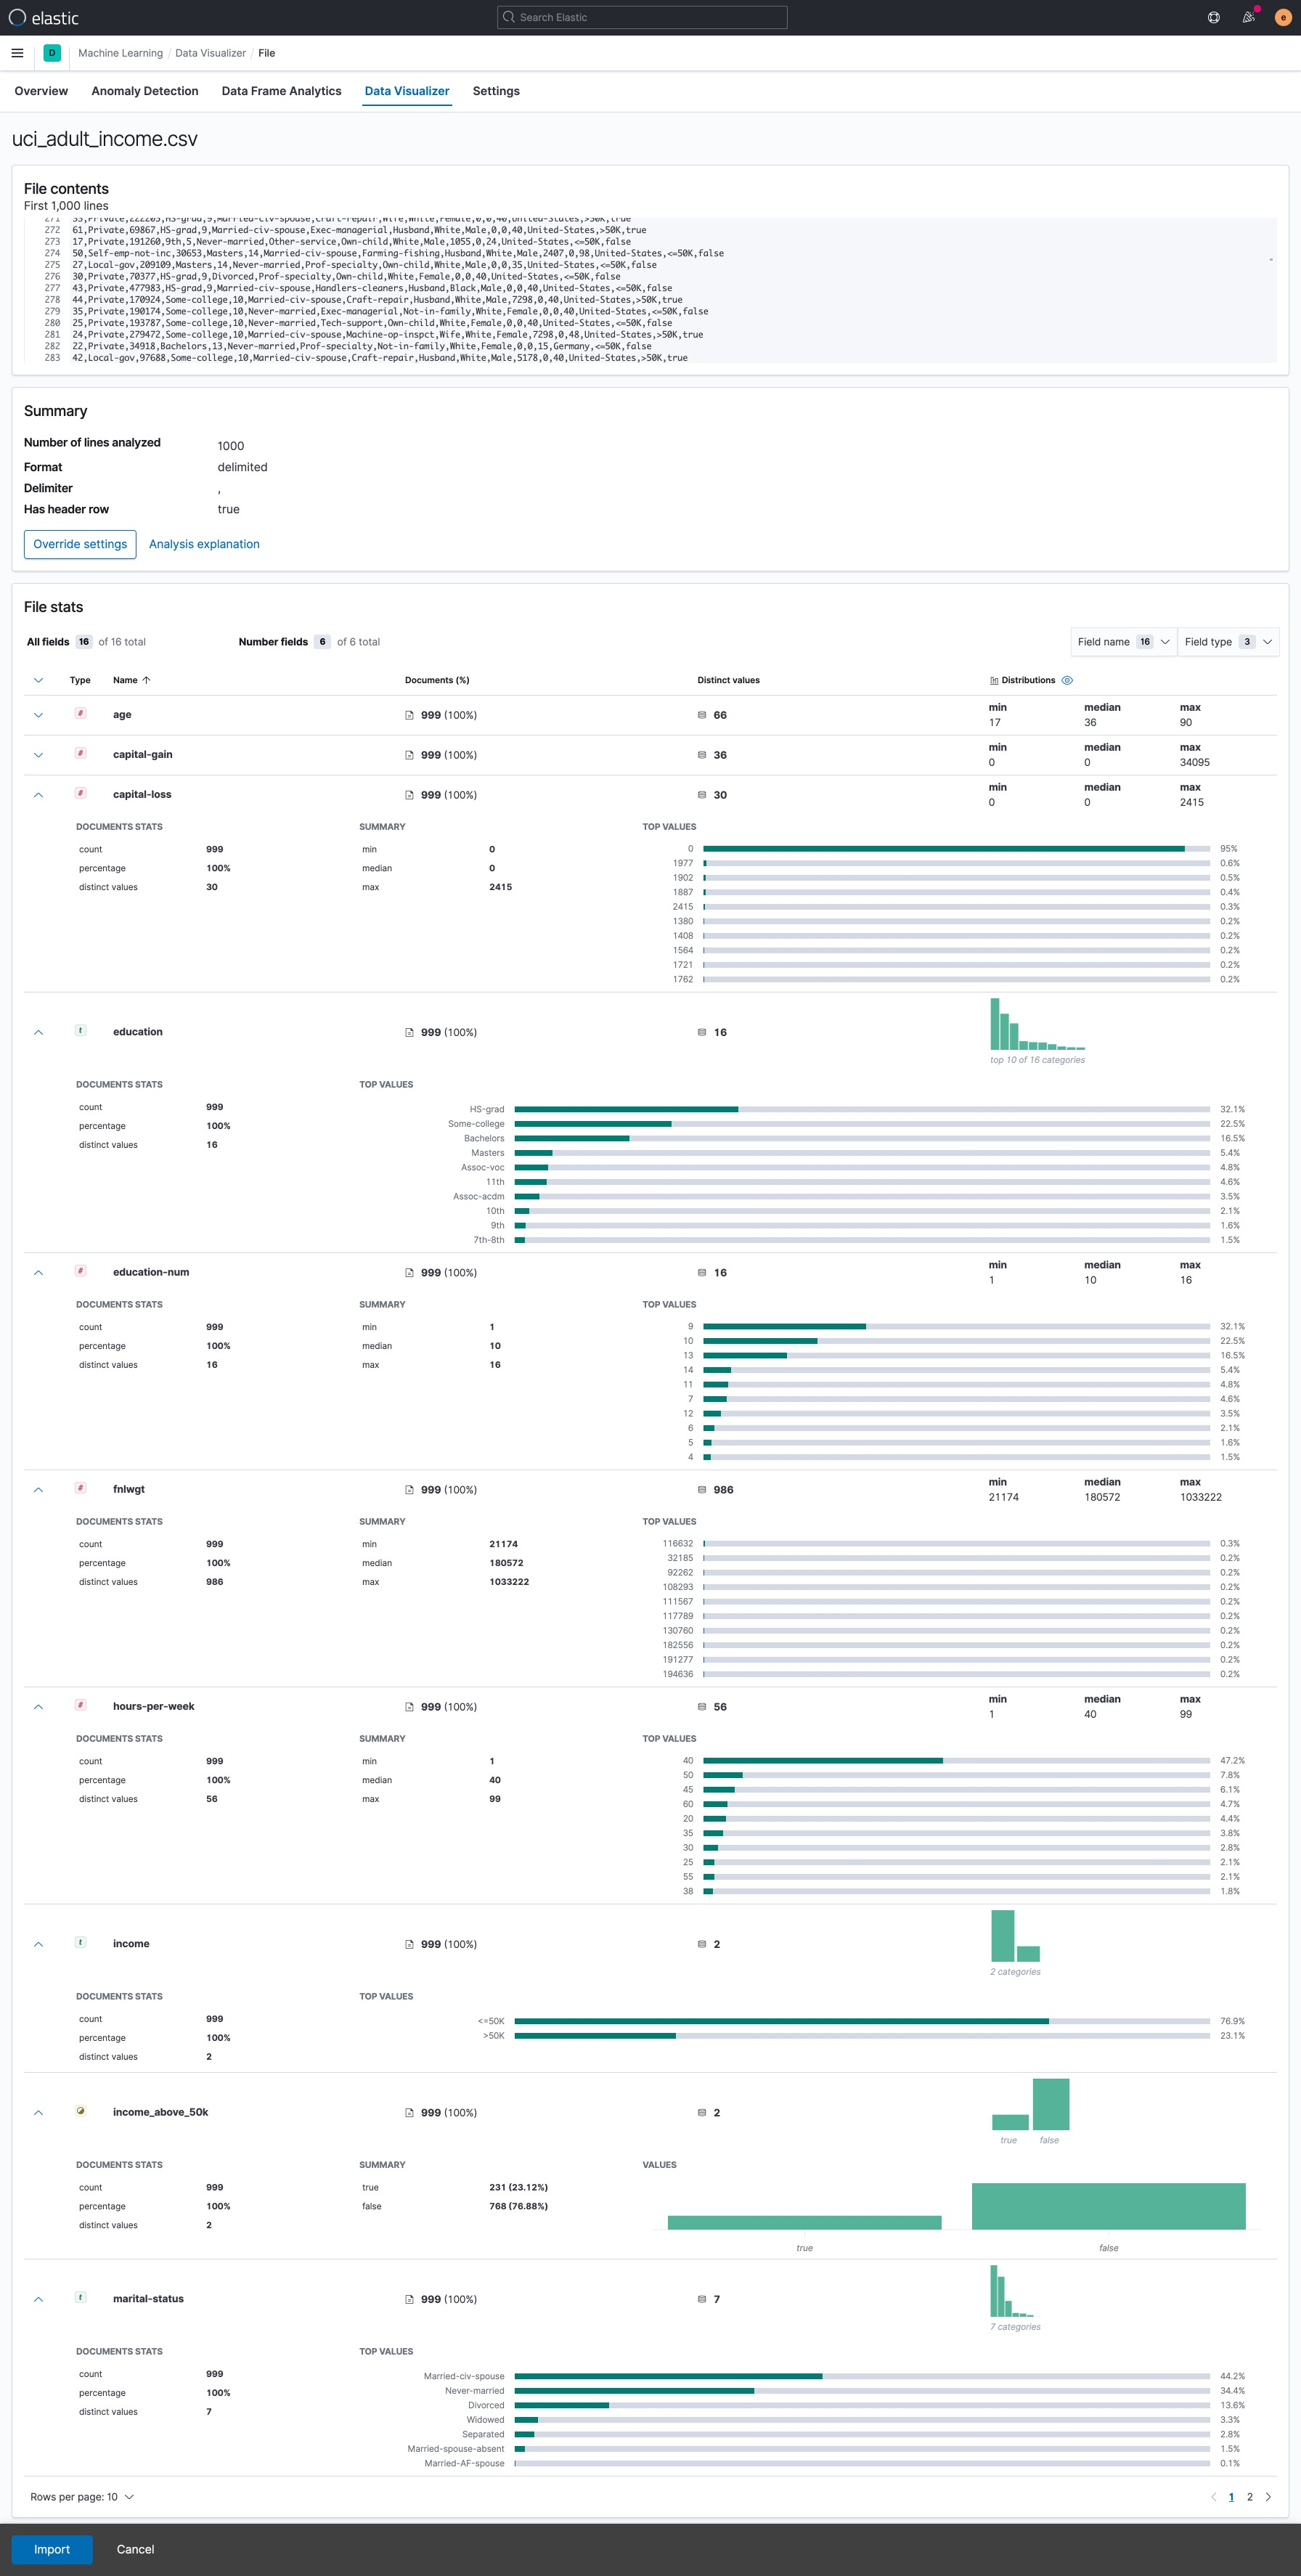
This PR is a follow up of #85726 which updates the file based data visualizer to follow the new design. It also updates the functional tests for file based data visualizer.
Before

After

Todo/Follow up PRs
Checklist
Delete any items that are not applicable to this PR.