Top legend not taken into account for vislib chart height #57791
Description
Kibana version: master
Elasticsearch version:
Server OS version:
Browser version:
Browser OS version:
Original install method (e.g. download page, yum, from source, etc.):
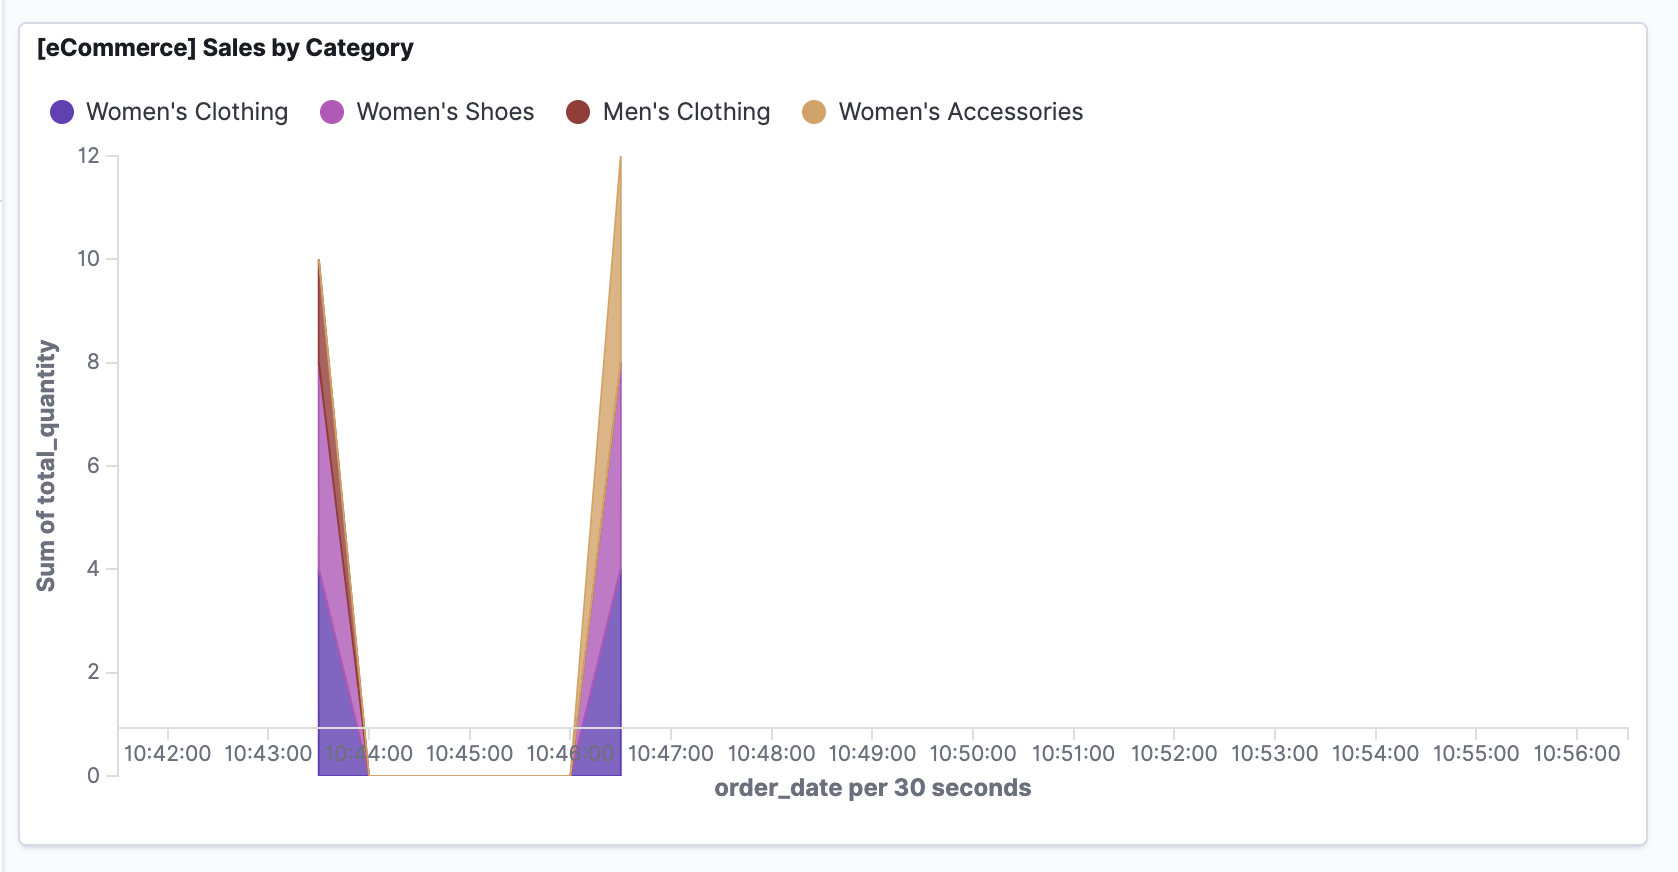
Describe the bug: If a top legend is chosen for vislib chart types, the chart overflows the x axis on the bottom of the chart.
Steps to reproduce:
- Create area chart with non-empty top legend and x axis on the bottom
- Add to dashboard
Expected behavior:
The additional height of the legend should be taken into account for the chart height.
Screenshots (if relevant):
Errors in browser console (if relevant):
Provide logs and/or server output (if relevant):
Any additional context: