[Stack Monitoring] [APM] Visualization differs from real data #45615
Description
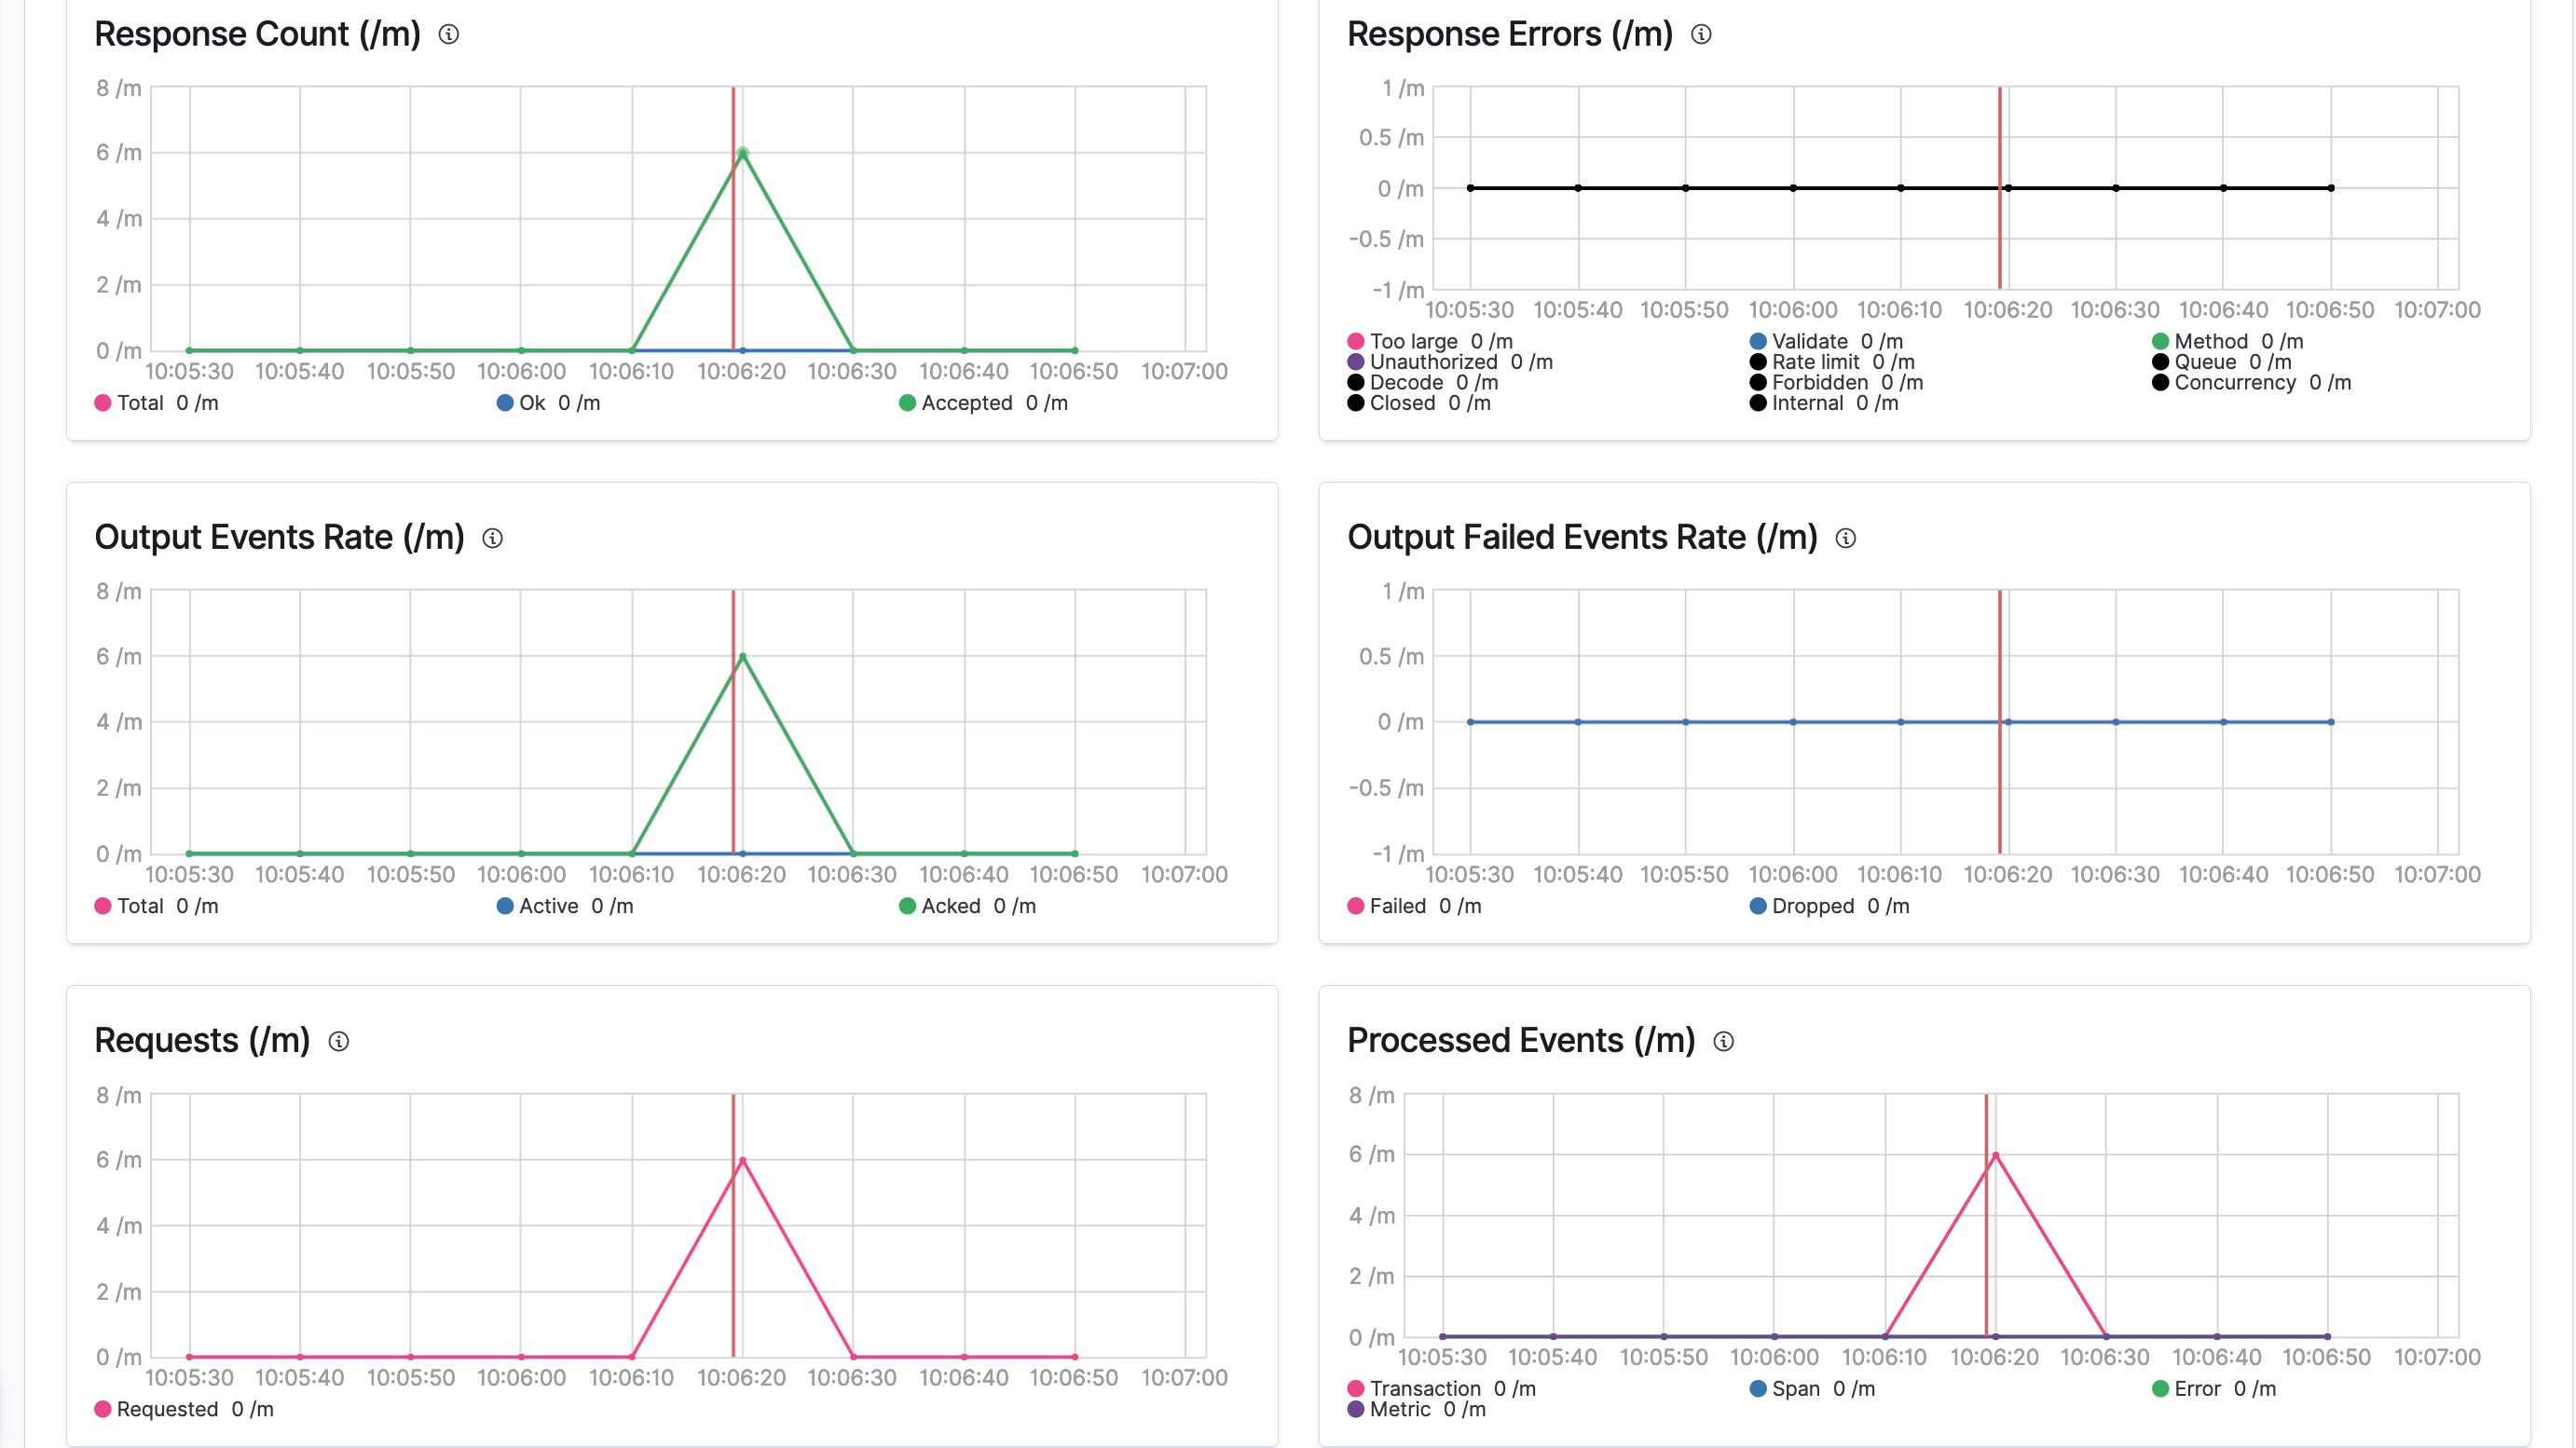
The visualized data for APM monitoring seem to diverge from the amount of data ingested. Breaking this down to only having 1 ingestion request containing 1 event, the visualization shows 6 requests/m and 6 events/m (see screenshot):
Looking at the indexed documents the data seem legit (increasing according counter values by 1).
Used version:
tested with 7.0 and master (Kibana, ES and APM Server)