Project to collect data on the current Blood Stock Position of the Pró-Sangue Foundation of the state of São Paulo Brazil.
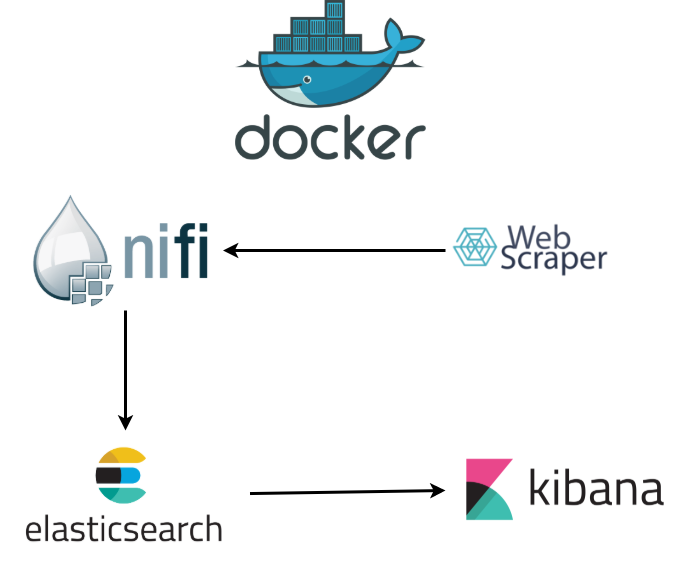
The project is a web scraper that collects the blood stock position on the Pró-Sangue Foundation of São Paulo website. The idea is to have a dataset with the collected data to be used for analysis and warning (threshold). The data is transformed a Json by a Python micro-service. Nifi creates the data pipeline, and sends the information to Elasticsearch, which Kibana can use to create the visualizations and dashboards.
For this test the environments were dockerized and the web scraper runs on the local machine.
This project uses the following technologies:
- Python
- Nifi
- Elasticsearch
- Kibana
The machine with NiFi and Elasticsearch with Kibana are dockerized.
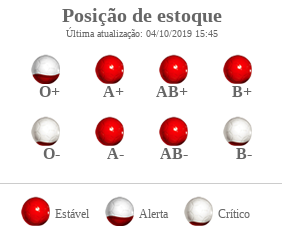
The web scraper monitors the following status on the site:
With python micro-service using the BeautifulSoup library and collected this information and transformed into the following Json:
[
    {
        "blood": "O+",
        "status": 2,
        "timestamp": "2019-10-07T17:48:24.899Z",
        "update": "2019-10-07T15:15:00.000Z"
    },
    {
        "blood": "A+",
        "status": 2,
        "timestamp": "2019-10-07T17:48:24.899Z",
        "update": "2019-10-07T15:15:00.000Z"
    },
    {
        "blood": "AB+",
        "status": 2,
        "timestamp": "2019-10-07T17:48:24.899Z",
        "update": "2019-10-07T15:15:00.000Z"
    },
    {
        "blood": "B+",
        "status": 2,
        "timestamp": "2019-10-07T17:48:24.899Z",
        "update": "2019-10-07T15:15:00.000Z"
    },
    {
        "blood": "O-",
        "status": 0,
        "timestamp": "2019-10-07T17:48:24.899Z",
        "update": "2019-10-07T15:15:00.000Z"
    },
    {
        "blood": "A-",
        "status": 2,
        "timestamp": "2019-10-07T17:48:24.899Z",
        "update": "2019-10-07T15:15:00.000Z"
    },
    {
        "blood": "AB-",
        "status": 2,
        "timestamp": "2019-10-07T17:48:24.899Z",
        "update": "2019-10-07T15:15:00.000Z"
    },
    {
        "blood": "B-",
        "status": 0,
        "timestamp": "2019-10-07T17:48:24.899Z",
        "update": "2019-10-07T15:15:00.000Z"
    }
]
Status is transformed into numbers, and dates are added with timezone, making it easy to create views with Kibana.
| Status | Portuguese | English |
|---|---|---|
| 0 | crítico | critical |
| 1 | emergência | emergency |
| 2 | estável | stable |
You need to have Python-3 installed on the virtualenv machine and docker. Both dockers must be running with Elasticsearch-Kibana and NiFi for the pipline.
For the tests just follow the steps described below:
Now run the commands below to compile the project:
$ git clone https://github.com/edersoncorbari/blood-donation.git
$ cd blood-donation/web-scraping
Enter pipenv at the root of the web-scraping folder for the tests:
$ pipenv shell
$ pipenv install
Starting the server:
$ ./server.pyIn another terminal either run the command below, or use the URL in the browser:
$ curljson -XGET http://127.0.0.1:5000/blood-current-positionThe json output will be like the example above containing the 8 blood types and current level of each.
Download NiFi:
$ docker pull apache/nifiAnd then start the docker with the commands:
$ docker run --name nifi \
  -p 8080:8080 \
  -d \
  apache/nifi:latest
Wait about 2 minutes and make sure NiFi has gone up to the address:
You will see the NiFi screen:
Note: You can use the (docker ps) command to see the status.
Now! then right click on (Upload template), and select the template that is in the project directory: (nifi/Blood-Donation-PipeLine-2019-10-07.xml)
Click (Upload) to upload the template.
Now click on the bar in templates. Simply drag and drop the component into the flow area.
Select template (Blood-Donation-PipeLine-2019-10-07) and import. Now you go to a process group:
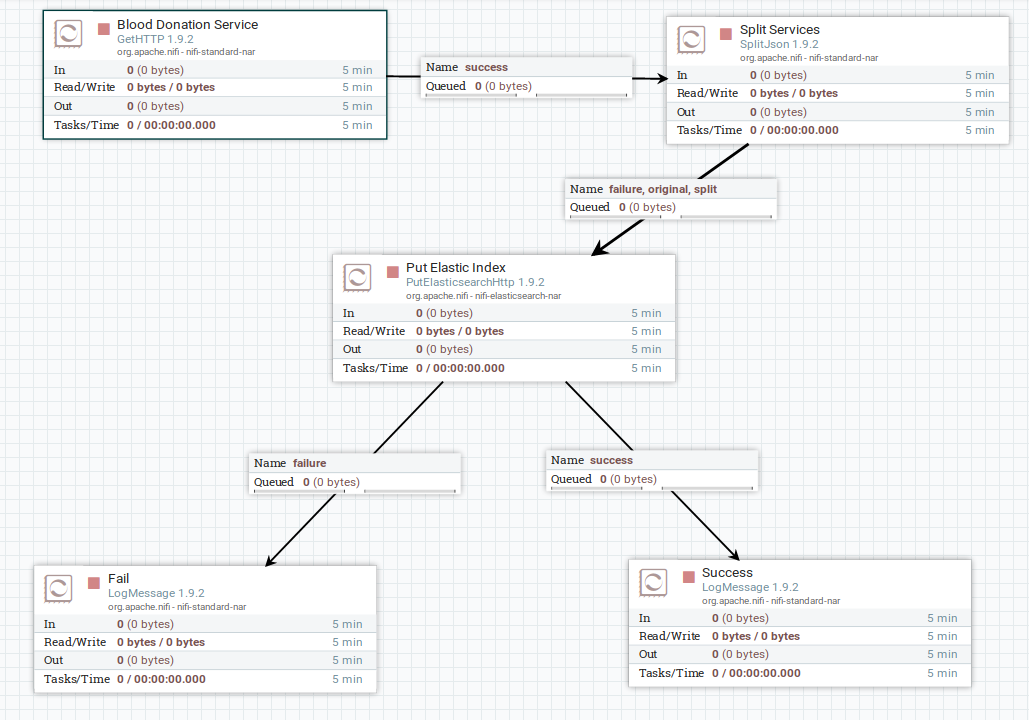
Within the process group is the flow. That reads the Python web-scraper and sends it to ElasticSearch.
Before starting the flow, it is necessary to raise the docker with Elasticsearch.
Download Elasticsearch and Kibana:
$ docker pull nshou/elasticsearch-kibanaAnd then start the docker with the commands:
$ docker run --name elasticsearch-kibana \
  -p 9200:9200 -p 5601:5601 \
  -d \
  nshou/elasticsearch-kibana:latest
Wait about 2 minutes and make sure Elasticsearch and Kibana has gone up to the address:
You will see the Kibana screen:
Click in (Explore on my own). Then click management in the left sidebar, and click on Kibana (Index Pattern).
When you start the pipeline, NiFi itself will create the index for Elasticsearch and you can map the index on this screen.
It is important to check your network settings. Check the NiFi IP number, the network 172.xx.x.x/16.
$ docker exec -it -u0 nifi ip aDo the same thing for the docker with Elasticsearch and Kibana:
$ docker exec -it -u0 elasticsearch-kibana ip aNote: Also check your local IP, a visible IP on the network where dockers have access.
Start web scraper on your local machine:
$ cd web-scraping && pipenv shell
$ ./server
In NiFi right click (Blood Donation Service) in properties changes to your local IP where the web scraper is running.
Now! Do the same thing for the processor (Put Elastic Index) and put the IP of the docker running Elasticsearch with Kibana.
Right click on NiFi flow and one (Start) in the pipeline.
In Kibana it is already possible to map the created index. The index name is blood-donation prefixed with the date of the day.
Map the index as the following images:
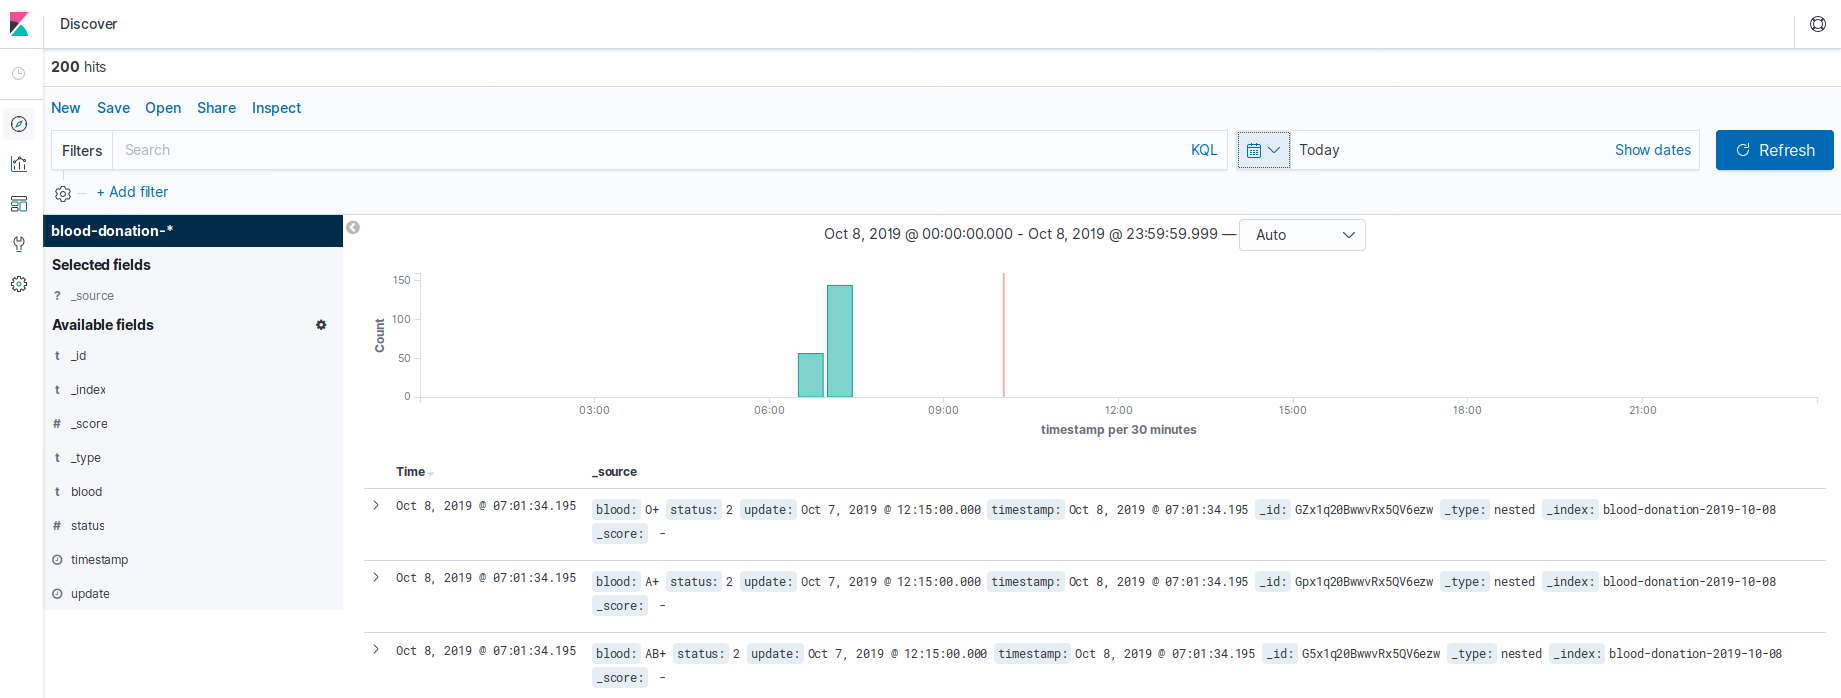
After mapping, click the (Discover) button in the left sidebar and view the data.
Note: Select the date for (Today) to display the data.
It is now possible to create some visualizations and dashboards to analyze the data.


