Reduce Pipeline contention redux #36992
Conversation
|
@benaadams it gives a lot of socket errors: I've uploaded the trace file to |
|
The Kestrel sockets one might be busted :-/ |
|
Could you try it without the Kestrel socket change? |
|
Yeah, Flush invalidates the memory, need to rethink the Kestrel one |
|
With updated Kestrel change dotnet/aspnetcore#22225: Alas it's a race to avoid the lock; but hopefully it should win more often. |
|
Updated the dlls (above); and moved the checks earlier to try to win the data race; also added lots of comments. |
And add lots of comments
30f5e50 to
d6b9038
Compare
|
@benaadams the results:
trace file uploaded to |
|
Those results are really strange; when the locks go down it does worse, and when they go up it does better. Wonder what bottleneck it hits when it goes faster, will look at the traces. |
|
I've used the PerfView to diff a trace file with and without your changes (it's hidden feature of perfview): The base is before, Test is after, everything filtered by time to after warmup:
It looks like it's now spending more time in |

|
@benaadams Plaintext:
|

|
Hmm... Plaintext (pipelines 16 requests) might be from making the Memory reservation too short; as I shorterned it to 1024 bytes in dotnet/aspnetcore@9d98835 Json that should be more than enough for the single request/response |
|
K, Json might be the Memory block being returned after the callback is triggered, so causing contention on the MemoryPool; will tweak |
|
New dlls in light of the Prefview comparisions |
|
The RPS has dropped for Plaintext to 9070k, but the trace I have just shows me which things got better (I need to get more traces): Compared to previous commits to this PR:
Compared to master;
|


|
JSON: new new vs new (almost no changes)
|

|
So I'm fairly at a loss to explain this; why all the trace data/metrics improve, but the performance degrades The main issue I can find is the one highlighted by @adamsitnik in #36992 (comment) and its related to Even though overall lock acquire time falls. it's lock acquire time jumps, which would throttle the throughput of the input data, adding latency back to offset all the gains: Before:
After:
Not sure why yet... |


|
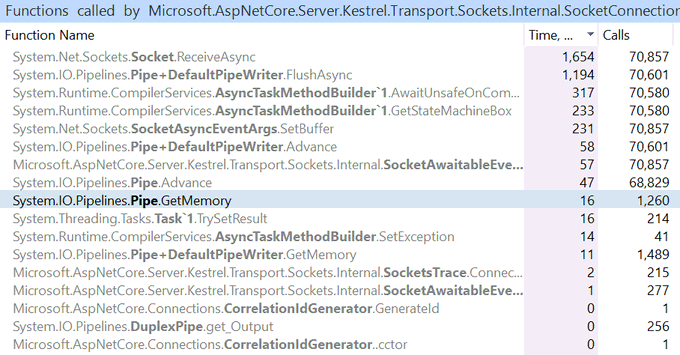
Added |
|
Cuts calls to
|
|
the plaintext result from "before" is 8kk while it should be more than 9kk. Most probably there was some other work executed on server|client machine. |

|
@benaadams I've run the benchmarks two more times for you, here are the results:
I'll now try to run the JSON benchmark with bombardier and collect traces that would allow for apples vs apples comparison (run |


|
I'd be interested a trace of the Mono Json (after) with those high locks; I assume its run on .NET Core despite the name? |
|
Also the plaintext, with the crazy high locks |
Yes, Mono is just machine name |
|
@sebastienros sth is wrong with the PS C:\Projects\aspnet_benchmarks\src\BenchmarksDriver> dotnet run -- --display-output --server $mono --client $monoload --connections 512 --jobs ..\BenchmarksApps\Kestrel\PlatformBenchmarks\benchmarks.plaintext.json --scenario PlaintextPlatform --sdk 5.0.100-preview.6.20272.2 --runtime 5.0.0-preview.6.20272.2 --aspnetcoreversion 5.0.0-preview.5.20255.6 --collect-counters --framework netcoreapp5.0 --collect-trace |
|
http://$mono/jobs/8/output Looks like the port is still in use. Maybe it didn't get cleaned up correctly. @fanyang-mono Do you think there could be other docker containers still running? In my scripts I force any container starting with |
Restart the server and it is working now. |
|
@fanyang-mono @sebastienros thank you! @benaadams I've captured and uploaded the traces:
|

|
Json after on Mono machine is spending 15% of time in ThreadPool Dequeue
Bunch of spinning also
Might be Numa issue? (or lots of cores issue) FYI @stephentoub @kouvel |


|
Yeah a large amount of the Mono machines time is spent in the synchnorisation primitves
|

|
@adamsitnik maybe the Citrine traces would be better; the Mono traces are just showing things can't do much about (with this PR) alas |
Most probably these threads are waiting for more work.
Here you go :D
|

|
Added API suggestion #37472 |
|
Revist post 5.0 |
Two individual commits #36956 and #36991
Plus dotnet/aspnetcore#22225
The two dlls:
/cc @adamsitnik