Excessive memory usage for message #4826
Description
Please describe the problem you are having in as much detail as possible:
First off, I'm not really sure this is actually a bug yet, but I'm opening this so I can track the digging and document things so far.
In my Grafana logging for my bot, I noticed that the memory usage for one of my shards had started to increase, out-of-line from all the other shards. Looking further, I then noticed that this seemed to match the calculated memory usage for cached messages in the shard.

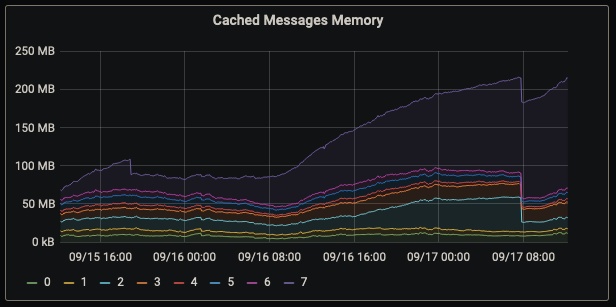
Memory RSS is generated from process.memoryUsage() so should be accurate, whereas Cached Messages Memory is an approximation using object-sizeof with an array containing every message in cache. However, this inaccuracy shouldn't matter as this is all about comparison between other shards and other messages.
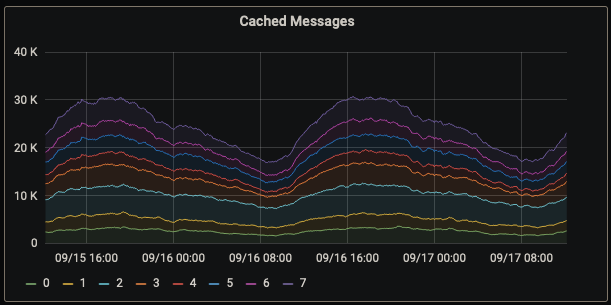
Alone, these two graphs don't say much, there are probably just more messages in that shard for one reason or another. Alas, there are not. Grafana also has a graph set up for the total number of messages in cache, using similar logic to Cached Messages Memory but without using object-sizeof, and we can see that there are a similar number of messages in the problematic shard to the other shards.
So, at this point, its safe to say that something is different about these messages that's causing them to use a load of extra memory. My next step in debugging what was going on was to get that largest message from each shard and just manually confirm that the messages in shard 7 were indeed much larger. This was done by executing the following script in all shards:
const sizeof = require('object-sizeof');
const messages = client.guilds.cache.array().reduce((prev, guild) => prev.concat(guild.channels.cache.array().reduce((prevC, channel) => { if ('messages' in channel) { return prevC.concat(channel.messages.cache.array()); } return prevC; }, [])), []).sort((a, b) => sizeof(b) - sizeof(a));
return [messages.length, sizeof(messages[0]), sizeof(messages[messages.length-1])];
With the following results:
Shard 0 Result
2404, 3814174, 3096

Shard 1 Result
2103, 96504, 3118

Shard 2 Result
5176, 30996, 3102

Shard 3 Result
3440, 1138488, 3106

Shard 4 Result
1820, 31540, 3128

Shard 5 Result
2514, 28520, 3012

Shard 6 Result
2373, 248242, 3154

Shard 7 Result
4050, 84625818, 3130
This confirmed for me that the messages in shard 7, the problematic shard, were definitely much larger than those in the other, nominal shards. Again, object-sizeof likely isn't being completely accurate with the size estimations, but what matters here is that it is consistent for the comparison between shards and messages.
With this confirmed, the next step was to understand what about the messages in this problematic shard were using so much memory. Again, using object-sizeof, I got the largest messages in the shard and calculated the size for a set of attributes that each message has in Discord.js:
const sizeof = require('object-sizeof');
const message = client.guilds.cache.array().reduce((prev, guild) => prev.concat(guild.channels.cache.array().reduce((prevC, channel) => { if ('messages' in channel) { return prevC.concat(channel.messages.cache.array()); } return prevC; }, [])), []).sort((a, b) => sizeof(b) - sizeof(a))[0];

return JSON.stringify(Object.keys(message).reduce((prev, key) => { prev[key] = sizeof(message[key]) / 1024 ** 2; return prev; }, {}), null, 2);
With the following result:
{
  "channel": 0.0026187896728515625,
  "deleted": 0.000003814697265625,
  "id": 0.000034332275390625,
  "type": 0.0000133514404296875,
  "system": 0.000003814697265625,
  "content": 0,
  "author": 0.0003662109375,
  "pinned": 0.000003814697265625,
  "tts": 0.000003814697265625,
  "nonce": 0,
  "embeds": 0.0007877349853515625,
  "attachments": 0,
  "createdTimestamp": 0.00000762939453125,
  "editedTimestamp": 0.00000762939453125,
  "reactions": 88.01104545593262,
  "mentions": 0.0001068115234375,
  "webhookID": 0,
  "application": 0,
  "activity": 0,
  "_edits": 107.88620185852051,
  "flags": 0.00002288818359375,
  "reference": 0
}
I also ran the same script in another shard (5) where memory usage appeared far more nominal, for comparison:
{
  "channel": 0.0026721954345703125,
  "deleted": 0.000003814697265625,
  "id": 0.000034332275390625,
  "type": 0.0000133514404296875,
  "system": 0.000003814697265625,
  "content": 0,
  "author": 0.0003490447998046875,
  "pinned": 0.000003814697265625,
  "tts": 0.000003814697265625,
  "nonce": 0,
  "embeds": 0.0044078826904296875,
  "attachments": 0,
  "createdTimestamp": 0.00000762939453125,
  "editedTimestamp": 0.00000762939453125,
  "reactions": 0.06316184997558594,
  "mentions": 0.0001068115234375,
  "webhookID": 0,
  "application": 0,
  "activity": 0,
  "_edits": 0.06797599792480469,
  "flags": 0.00002288818359375,
  "reference": 0
}
Include a reproducible code sample here, if possible:
See above.
Further details:
- discord.js version: 12.3.1
- Node.js version: 12.18.0
- Operating system: Windows Server 2016 (deal with it)
- Priority this issue should have – please be realistic and elaborate if possible: N/A
Relevant client options:
- partials: none
- gateway intents:
(new Intents()).add(
    Intents.FLAGS.GUILDS,
    Intents.FLAGS.GUILD_MEMBERS,
    Intents.FLAGS.GUILD_BANS,
    Intents.FLAGS.GUILD_EMOJIS,
    Intents.FLAGS.GUILD_MESSAGES,
    Intents.FLAGS.GUILD_MESSAGE_REACTIONS,
    Intents.FLAGS.DIRECT_MESSAGES,
)- other:
messageCacheMaxSize: 10,
messageCacheLifetime: 30 * 60,
messageSweepInterval: 5 * 60,- I have also tested the issue on latest master, commit hash: