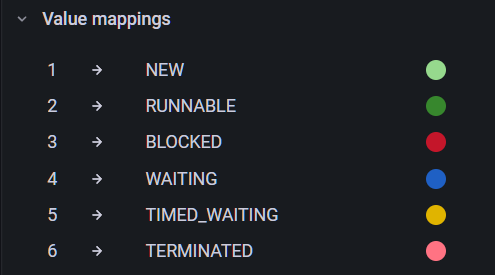
Purpose of the JVMThreadStatesRecorder is to write JVM thread states (like runnable, blocked ...) to the InfluxDB and then visualize those states in the Grafana, etc. 🧵

java -jar JVMThreadStatesRecorder.jar 7080 http://127.0.0.1:8086 JVMThreadStatesRecorder
- java (version 11 or later)
- JVMThreadStatesRecorder.jar can be taken from out/artifacts/JVMThreadStatesRecorder_jar/
- 7080 (a port to start web server; a default port: 7070)
- http://127.0.0.1:8086 (an url to the InfluxDB; optional)
- JVMThreadStatesRecorder (DB name in the Influxdb; optional)
POST /influxdb-configuration
body:
{
"influxdbUrl":"http://127.0.0.1:8086",
"influxdbDb":"JVMThreadStatesRecorder",
"influxdbMeasurement":"thread_states",
"influxdbBatchSize":"1000",
"influxdbBatchTime":"10"
}
"influxdbDb":"jvm_app_monitoring", (optional, default: JVMThreadStatesRecorder)
"influxdbMeasurement":"thread_states", (optional, default: thread_states)
"influxdbBatchSize":"1000", (optional, default: 1000)
"influxdbBatchTime":"10" (optional, default: 10)
POST /start
body:
{
"jmxHost":"127.0.0.1",
"jmxPort":"9010",
"threadFilter":"Example",
"threadStates":"true",
"contentionMonitoring":"true",
"tags":{
"tag1":"value1",
"tag2":"value2"
}
}
response: id of the task that can be used for stopping the task
"threadFilter":"Example" (optional, default: all threads, carefull, there could be hundreds of threads)
"threadStates":"true" (true or false. Enable thread states monitoring)
"contentionMonitoring":"true" (true or false. Enable contention monitoring, blocked count and blocked time)
"tags":{....} (optional, additional tags for enriching data in the InfluxDB)
POST /start
body:
{
"pid":"44620",
"threadFilter":"Example",
"threadStates":"true",
"contentionMonitoring":"true",
"tags":{
"tag1":"value1",
"tag2":"value2"
}
}
response: id of the task that can be used for stopping the task
"threadFilter":"Example" (optional, default: all threads, carefull, there could be hundreds of threads)
"threadStates":"true" (true or false. Enable thread states monitoring)
"contentionMonitoring":"true" (true or false. Enable contention monitoring, blocked count and blocked time)
"tags":{....} (optional, additional tags for enriching data in the InfluxDB)
GET /stop/id={id of the task}
GET /tasks
response:
{
  (id of the task):
  {
    (Configuration.Configuration object of the task)
  },
  ...
}
GET /dbconfig
GET /internal-monitoring
Shows time in ms. which is spent on collecting thread states, grouped by a task
📈 JVM_Thread_States_Dashboard.json
Tested with Grafana 8.4.3

Shows total number of times that a thread blocked to enter or reenter a monitor and time that a thread has blocked to enter or reenter a monitor
📈 JVM_Thread_States_Dashboard.json


Shows time in ms. which is spent on collecting thread states, grouped by a task
📈 JVM_Thread_States_Dashboard.json
