This Python library extends the functionality of the readily available and free interactive graph editing program yEd, through providing a programmatic interface to graphs (of the GraphML file format), including the following use case or functions:
- creating graphs
- formatting graphs
- reading graphs
- bulk data addition or management (spreadsheet-based)
- management of the yEd application (starting, killing, etc.)
- enforcing rules on graphs
- additional layout methods
- graph comparison tools
Below are some basic usages of yEdExtended in interfacing with yEd and GraphML files:
From PyPI, using pip:
$ pip install yedextended From GITHUB, using pip:
$ python -m pip install git+https://github.com/cole-st-john/yEdExtendedFrom GITHUB, using git:
$ git clone https://github.com/cole-st-john/yedextendedimport yedextended as yedWith yEdExtended you can easily create graphs, either through hardcoding, or more practically, through porting data from any data source (databases, csv, xml, etc) into a graph and graph objects (nodes, groups, edges, properties):
Hardcoding Example:
# Instantiate graph instance
graph1 = yed.Graph()

# Adding arbitrary graph detail - nodes
a = graph1.add_node("a")
b = graph1.add_node("b")

# Adding edge (using node objects)
graph1.add_edge(a, b)

# Add arbitrary graph detail - group and group objects
group1 = graph1.add_group("group 1", shape="rectangle")

# Adding edge using node names, under owning group
group1.add_edge("c", "d")
Programmatic Example:
# Instantiate graph instance
graph1 = yed.Graph()

# Adding graph objects based on csv input
with open("examples/test.csv", encoding="utf-8-sig") as csv_file:
    csv_reader = csv.reader(csv_file)
    for row in csv_reader:
graph1.add_node(row[0])yEdExtended can read GraphML files into a Python class structure, allowing for simple programmatic analysis and modification:
# Read graph file into python graph objects
graph1 = yed.Graph().from_existing_graph("examples/yed_created_edges.graphml")yEdExtended provides for the majority of formatting one expects in yEd graphs.
# Add graph nodes and edges with some examples of non-default formatting
graph1.add_node("foo", font_family="Zapfino")

graph1.add_node(
    "foo2",
    shape="roundrectangle",
    font_style="bolditalic",
    underlined_text="true",
)

graph1.add_edge("foo1", "foo2")

graph1.add_node("abc", font_size="72", height="100")

graph1.add_node("Multi\nline\ntext")

graph1.add_node("foobar").add_label("""Multi
Line
Text!""")

graph1.add_edge(
    "foo",
    "foo1",
    name="EDGE!",
    width="3.0",
    color="#0000FF",
    arrowhead="white_diamond",
    arrowfoot="standard",
    line_type="dotted",
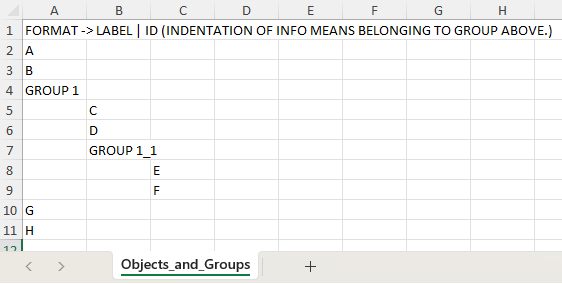
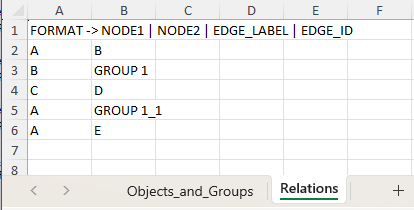
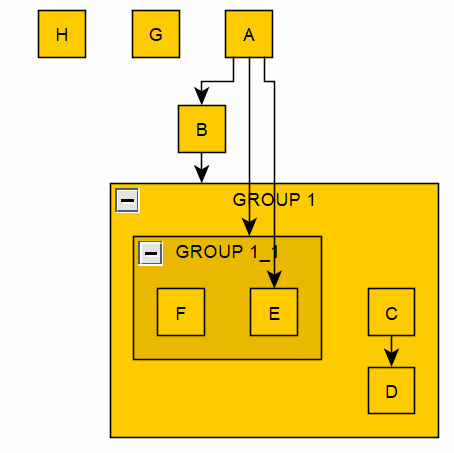
)Sometimes, it is practical to mass edit or enter data in an interactive way. yEdExtended includes functionality to enter basic to complex data and relationships using an interface to spreadsheet app interface. Note: to use this functionality, a spreadsheet app must be installed and on path:
# Instantiate a graph
graph1 = Graph()

# Manage data in spreadsheet (add/remove/modify objects)
graph1.manage_graph_data_in_spreadsheet() # default is object and hierachy management

# Manage data in spreadsheet (add/remove/modify relations)
graph1.manage_graph_data_in_spreadsheet(type="relations")Eventually, one normally wants to visualize or transmit the graph in some format. Here are a few options:
# Demonstrate stringified GraphML version of structure
print(graph1.stringify_graph())
# Several methods of writing graph to file ==============================
with open("test_graph.graphml", "w") as fp: # using standard python functionality
fp.write(graph1.stringify_graph())
graph_file = graph1.persist_graph("test.graphml") # using tool specific method
graph_file = graph1.persist_graph("pretty_example.graphml", pretty_print=True) # tool specific with formattingTo ease task switching between Python and yEd, functionality has been added to open graphs in yEd directly from Python. Note: ensure you have installed yEd application from here and that the app is on PATH (Win: "where yed.exe" in CMD should output a path).
# Instantiating Graph
graph = Graph()

# Saving graph to file
graph_file = graph.persist_graph()

# Opening graph in yEd from file handle
graph_file.open_with_yed(force=True)

# Opening graph directly from file
yed.open_yed_file("examples/test.graphml")Following programmatic creation or modification of a graph, consider using the following keystrokes in yEd to improve layout / positioning (yEdExtended does not currently include functionality for layout, which is readily available in yEd):
Tools -> Fit Node to Label(Win: Alt + T + N)Layout -> Hierarchical(Win: Alt + Shift + H)
Provides comprehensive support for great variety of node_shapes, line_types, font_styles, arrow_types, custom parameters, UML, complex and deeply nested relationship structures and more.
yEdExtended v2.0.0 is a major rewrite focusing on a instantiation method - using names vs ids. These changes can be summarized as following:
-
Backend ID Management: The responsibility for managing IDs has been shifted primarily to the backend. This significant update enables the following enhancements:
-
Support for Duplicate Names: Allows the use of duplicate names across different levels and areas within a graph.
-
Unique and Trackable IDs: Despite allowing duplicate names, the system now provides and maintains unique and trackable IDs for all graph objects.
This change simplifies object handling, ensuring better consistency and flexibility, especially in larger graph management.
Interested in contributing or co-managing further development? Just reach out!
Dev. Requirements:
-
Install yEd from here.
-
Ensure you have a spreadsheet app installed:
-
Install required package dependencies (per one of these methods):
- pip:
$ pip install -r dev-requirements.txt
-- OR --
- uv:
- Install UV
- Run uv sync in the repository:
$ uv sync
- pip:
To run the tests:
$ uv run pytest -v .References:


