This code here was written to analyze timestamp data for a web service. Timestamps correspond to user logins and are thus a proxy for demand of the web service. The aim was to visualize and analyze past data for future predictions. 'plot.ipynb' demonstrates how to use functions in 'dataprep.py' and 'predict.py' to munge data, and visualizes data via Matplotlib (see 'Data Patterns' below for a discussion of such an analysis). Some functions may be hardcoded at the moment to assume that a file named 'hourly_demand_prediction_challenge.json' exists in the same folder as these Python files. This is contains a JSON array of timestamp strings (see 'Methods' section below).
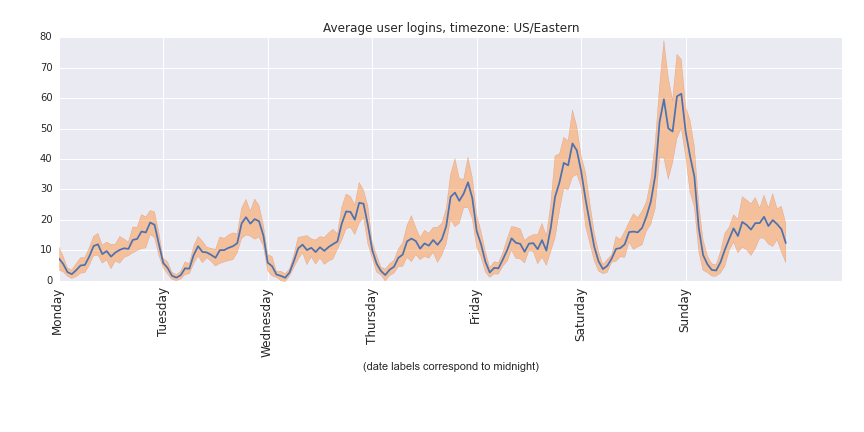
The demand for this service seems to be a good proxy for urban nightlife. All weekdays show a similar pattern, peaking in the evenings and reaching a minimum during peak sleeping hours. Friday and, especially, Saturday night show surges of activity and indicate a correlation with social activity & after work events. There is also greater usage on Saturday during the day than weekdays during the day.
To enhance predictions and reduce dimensionality, days could be aggregated into 'types of days' and hours into 'types of hours'. For example, Monday, Tuesday, Wednesday, could all be typical work days. These could be similarly broken down into 4 sections: (i) sleep, (ii) morning commute, (iii) work, and (iv) social events / evening commute. Friday and Saturday night also have distinctive socially-influenced patterns.
Further insight could be gathered by combining other data sources with these data. I would expect usage of this service would increase during rainy weather and perhaps decrease during very bad weather. Such dates could be classified and correlations could be measured to enhance predictions. Special events like concerts and sports games would also have classifiable & measurable usage patterns and holidays would also be atypical days that could be isolated manually and analyzed for usage patterns.
All functions feature docstrings that can be read via Python's interactive help() function.
Two simple ways of computing a demand prediction are currently available.
-
sample mean (conventional): This is the usual sample mean of all past usage counts. Specifically, given a specific weekday and hour, this method averages over all past usage counts for this hour on this weekday for past days in which these data were collected.
-
sample mean (exponentially downweighted): This method weights recent data more heavily. This is done my multiplying each data point by s**i, where s is some scaling factor between 0 and 1 (0.97 by default here) and i is the number of weeks since the most recent data point in the set being averaged. This sum is normalized by the sum of all weights in order to get an exponentially downweighted mean (see, e.g., Cathy O'Neil's blog post here for more).
Several functions depend on a file named 'hourly_demand_prediction_challenge.json' by default (not include in this repo). This file contains a JSON array that consists entirely of timestamp strings. These strings correspond to user logins, which is a proxy for demand of some web service, formatted as '%Y-%m-%dT%H:%M:%S+00:00' (more info about such formats can be read via the Datetime module documentationn).
'helper.py' contains several methods that are useful for cleanly interfacing with the API in Python scripts (see next section for more detail).
The 'api.py' file implements methods discussed above as a Flask-based application programming interface (API). This allows users to query and add to the dataset using HTTP requests. To start the server on http://locahost:5000, run
$ python api.py
 * Running on http://127.0.0.1:5000/
 * Restarting with reloader
Once this is running (and 'hourly_demand_prediction_challenge.json' is present), unit tests can be run via the doctest module,
$ python -m doctest -v api.py
...
5 passed and 0 failed.
Test passed.
$ python -m doctest -v helper.py
...
18 passed and 0 failed.
Test passed.
The 'helper.py' file contains simplified functions for interfacing with the API via Python scripts. As an alternative to formatting HTTP requests directly, these functions handle simple arguments to POST and GET data to and from the demand predictor application. These include:
add_datafile(datafile): stream a JSON datafile containing timestamps into the demand predictor web application. This is a proxy for the /api/predict API call, which can be used directly to send in comma-delimited timestamps from a properly formatted URL. Raw data can then be viewed by the /api/alldata GET method as a JSON formatted file.
predictor(weekday, hour): given a 3-letter abbreviation for a weekday (e.g., 'mon') and an integer from 0 to 23 specifying lower bound of an hourlong time window in a day, this will respond with a usage prediction. This is a proxy for the /api/predict API call.
predictor_daterange(datestr1, datestr2): given 2 date ranges formatted as '%Y-%m-%d', this will return a comma-separated string containing a prediction for each hour of each day (in the UTC timezone) in this range. Dates must be in the future of all previous data and datestr1 is earlier than datestr2. This is a proxy for the /api/predict-daterange-utc API call.
For more detail on how to use these and other functions in this repo, please read docstrings in the source or via Python's interactive help() method, e.g.,
>>> import helper
>>> help('helper')
within this directory to see more detailed usage instructions.
The 'helper.py' file can also be executed as a script to communicate with the demand predictor application in order to request predictions and add data,
$ python helper.py -mode predict -weekday mon -hour 14
logins (predicted)        9.031234
+/- error                 2.825027
$ python helper.py -mode insert -filename hourly_demand_prediction_challenge_misformatted.json
22445 of 22446 timestamp(s) inserted.
(1 timestamp(s) skipped due to misformatting.)
Run python helper.py -h for usage instructions.
- More modern prediction methods could be implemented straightforwardly. In particular methods for autoregression in the StatsModels Python library should be accessible and could give better performance.
- At the moment, statistical averages are re-calculated from scratch at each insertion of a new set of timestamp data. With some minor refactoring, running averages could instead by updated on the fly.
- The Flask web app currently keeps global variables that maintain the timestamp data, which can be updated. To make this threadsafe, global variables should be avoided in favor of, e.g., database objects.
- Structures that contain processed data (hours, usage, hourly_usage_stats) are currently kept as lists. Methods could be streamlined if these were handled by dicts instead (though these data should primarily be stored in, e.g., a database).
- Combine these timestamp data with external data about special events, holidays, weather, etc, to further classify data and give more informed predictions.
- Conform docstrings to PEP conventions.