Skip to content

Added ;plot progress #482

New issue

Have a question about this project? Sign up for a free GitHub account to open an issue and contact its maintainers and the community.

By clicking “Sign up for GitHub”, you agree to our terms of service and privacy statement. We’ll occasionally send you account related emails.

Already on GitHub? Sign in to your account

Merged
merged 2 commits into from
Jan 6, 2022
Merged

Added ;plot progress #482

merged 2 commits into from
Jan 6, 2022

Conversation

kish1n
Copy link
Contributor

@kish1n kish1n commented Dec 31, 2021

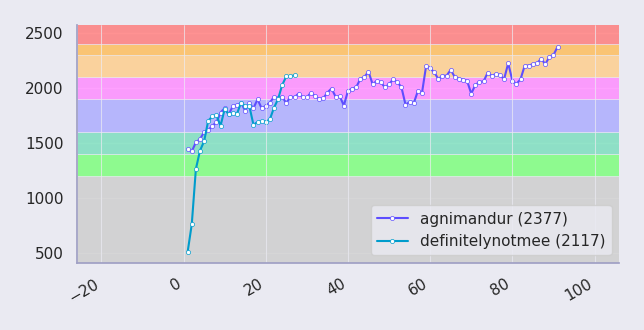
Hello, this creates a new way to plot. It is similar to ;plot rating except the x-axis is contest number for that user (i.e. if a user compete in 10 contests, x-axis is from 1-10), thus evenly spacing out contests for them on the graph. For multi-user, the user with less contests has their graph cut off at contest x where x is that user's last contest. This provides an interesting way to compare users.
image

RESOLVES #481

@krofna
Copy link
Collaborator

krofna commented Jan 3, 2022

@algmyr what do you think? should this just be a flag for plot rating or this is good?

@algmyr
Copy link
Collaborator

algmyr commented Jan 3, 2022

@algmyr what do you think? should this just be a flag for plot rating or this is good?

Considering the logic in the command function is pretty much identical it probably makes more sense as a flag.

@kish1n
Copy link
Contributor Author

kish1n commented Jan 4, 2022

@algmyr what do you think? should this just be a flag for plot rating or this is good?

Considering the logic in the command function is pretty much identical it probably makes more sense as a flag.

I can change this to a flag. I noticed while testing, putting the legend in the bottom right was much better on average than putting it in top left (since rating graphs are often more like logarithmic curve than linear), can I change the plot in general to make it bottom right legend or should I do it just for this flag (where this problem is more severe)

@algmyr
Copy link
Collaborator

algmyr commented Jan 4, 2022

I noticed while testing, putting the legend in the bottom right was much better on average than putting it in top left (since rating graphs are often more like logarithmic curve than linear), can I change the plot in general to make it bottom right legend or should I do it just for this flag (where this problem is more severe)

Getting the positioning correct is not easy. Bottom-right will mess up the plot for people who have a big rating dip or who converge to a rating lower than the starting one. Top-left was chosen because it mostly only messes up for people who never exceed their starting rating. It's not perfect, but it tended to be better behaved than letting matplotlib pick the legend position.

I would expect curves to often be similar between the date and num_contest plots, so it probably makes sense to have the same behavior for both. I would vote top-left for both, but @meooow25 @krofna please chime in.

@kish1n
Copy link
Contributor Author

kish1n commented Jan 4, 2022

I noticed while testing, putting the legend in the bottom right was much better on average than putting it in top left (since rating graphs are often more like logarithmic curve than linear), can I change the plot in general to make it bottom right legend or should I do it just for this flag (where this problem is more severe)

Getting the positioning correct is not easy. Bottom-right will mess up the plot for people who have a big rating dip or who converge to a rating lower than the starting one. Top-left was chosen because it mostly only messes up for people who never exceed their starting rating. It's not perfect, but it tended to be better behaved than letting matplotlib pick the legend position.

I would expect curves to often be similar between the date and num_contest plots, so it probably makes sense to have the same behavior for both. I would vote top-left for both, but @meooow25 @krofna please chime in.

hmm I think I may not have observed bottom right messing up that much because of the change that everyone starts with 0 rating (and few ever stay around there), but I can see how that could be problem of older users rating graphs. Anyway, I'll wait for other opinions.

@kish1n
Copy link
Contributor Author

kish1n commented Jan 6, 2022

For now, I made it a flag (left the legend stuff untouched) and refactored the code better. maybe we can get this merged in the mean time? @algmyr

Copy link
Collaborator

@algmyr algmyr left a comment

Choose a reason for hiding this comment

The reason will be displayed to describe this comment to others. Learn more.

LGTM

@algmyr algmyr merged commit d7674b1 into cheran-senthil:master Jan 6, 2022
ParsaAlizadeh pushed a commit to ParsaAlizadeh/TLE that referenced this pull request Jan 29, 2022
* Added ;plot progress

* Made +number a flag for ;plot rating

Co-authored-by: Ashwin Kishin Banwari <ashwin@4d-printer.localdomain>
(cherry picked from commit d7674b1)
Sign up for free to join this conversation on GitHub. Already have an account? Sign in to comment
Labels
None yet
Projects
None yet
Development

Successfully merging this pull request may close these issues.

Feature Request: plot rating but contests evenly spread rather than by time
3 participants