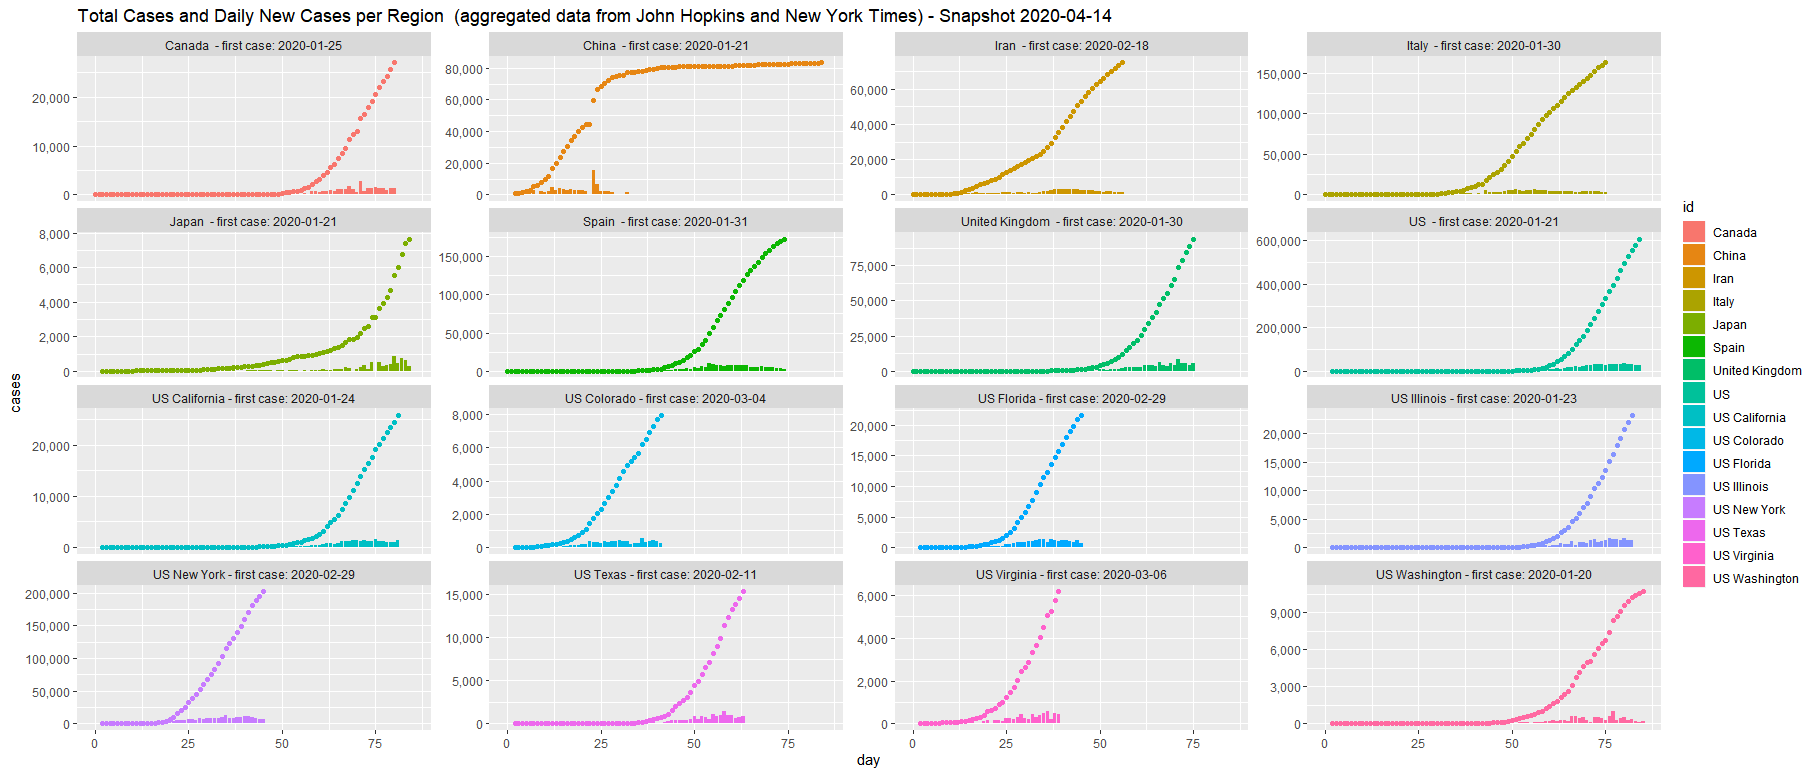
This R code dynamically reads in COVID19 data provided by John Hopkin University and New York Times through their github.
It plots time series of different countries around the world and several US states via ggplot.
| Name | Name | Last commit date | ||
|---|---|---|---|---|
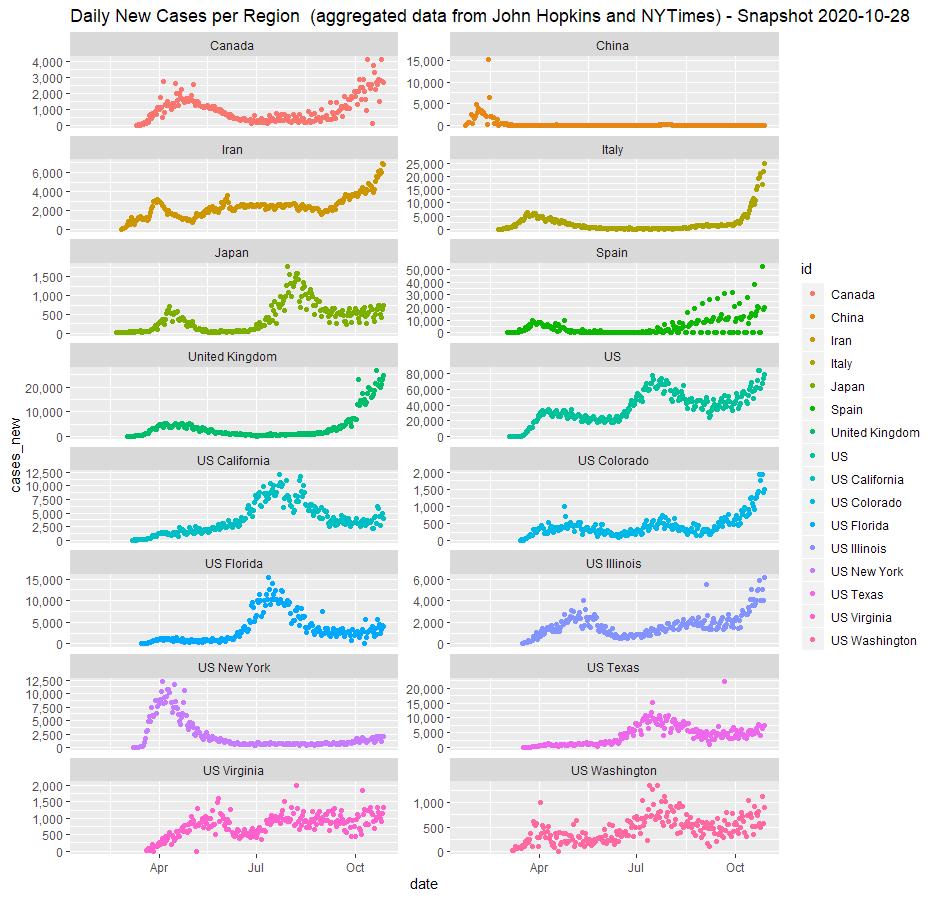
This R code dynamically reads in COVID19 data provided by John Hopkin University and New York Times through their github.
It plots time series of different countries around the world and several US states via ggplot.