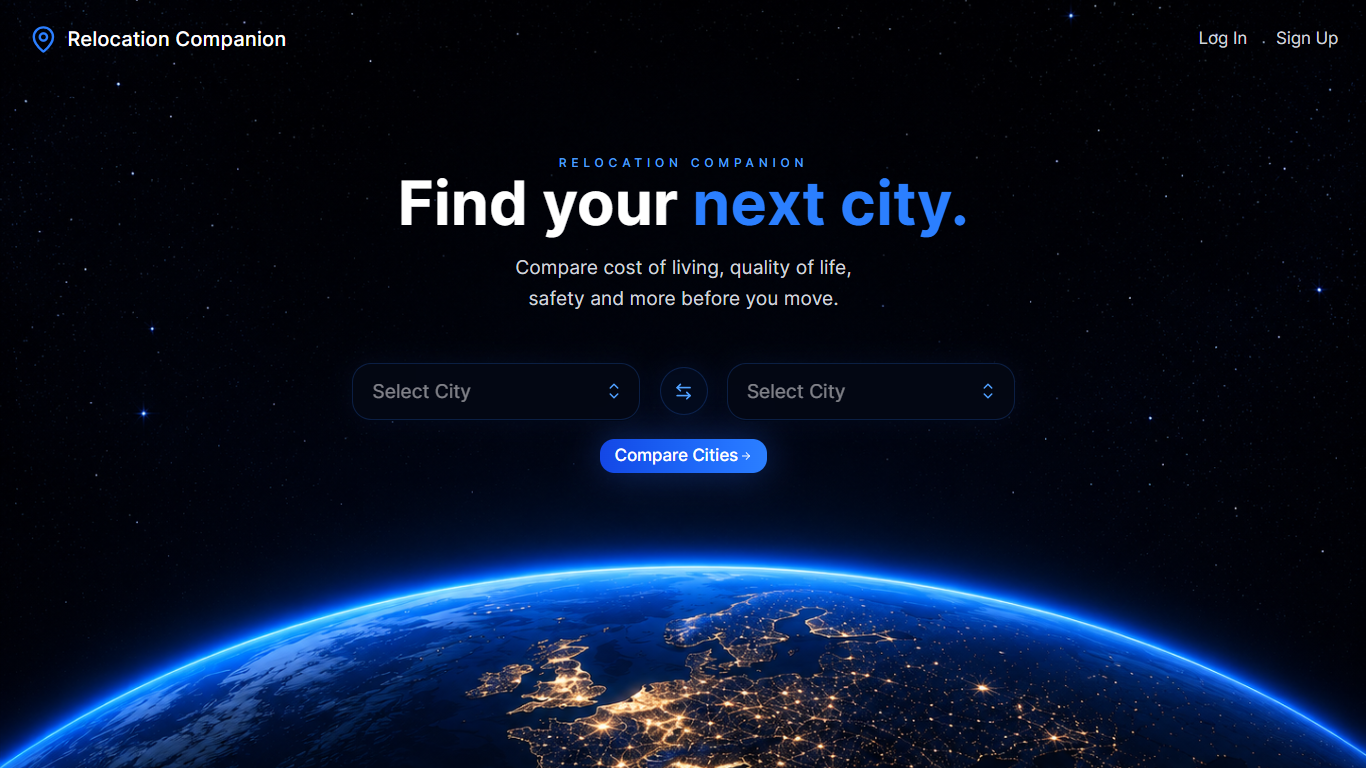
A MERN app to compare cities side-by-side across affordability, cost of living, quality of life, healthcare, safety, and environment, helping you make confident, data-driven relocation decisions.
- Frontend: https://relocation-companion-pro.vercel.app/
- Backend API: https://relocation-companion-api.onrender.com
- Repository: https://github.com/betterversionofpuja/relocation-companion
- 🌍 City Comparison
- 🔐 Authentication
- ❤️ Saved Comparisons
- 👤 User Profile
- 📱 Responsive Design
- React
- Tailwind CSS
- Axios
- React Router
- React Context API
- Lucide React
- Node.js
- Express REST API
- MongoDB
- Mongoose
- JWT
- Cookie Parser
- CORS
- Vercel
- Render
relocation-companion/
│
├── assets/                 # README images & screenshots
│   └── homepage.png
│
├── backend/                # Express REST API
│
├── deployment/             # Deployment notes & debugging journey
│
├── frontend/               # React application
│
└── README.md
This project uses the World Cost of Living & Quality of Life (2024–2025) dataset from Kaggle.
-
Financial / Cost Columns (Average Monthly Rent, Internet Costs, Average Salaries)
- Unit: USD (United States Dollars)
- Monetary values are standardized in USD, allowing meaningful comparisons across different cities and countries.
-
Cost Indices (Food Cost Index, Transport Cost Index)
- Unit: Index Points (Relative Score)
- These values are benchmarked against a base city (typically New York City = 100).
- For example, a Food Cost Index of 120 means the city is approximately 20% more expensive than the baseline.
-
Quality of Life Metrics (Quality of Life, Safety, Healthcare, Pollution)
- Unit: Score / Index (typically on a scale of 0–100)
- For Quality of Life, Safety, and Healthcare, higher scores indicate better conditions.
- For Pollution, higher scores indicate higher pollution levels (worse quality).
-
Temporal Column (Year)
- Unit: Calendar Year (
2024and2025).
- Unit: Calendar Year (
Note: The dataset is synthetically generated using realistic ranges rather than live scraped data. It is intended for educational purposes, data visualization, exploratory data analysis (EDA), machine learning, and application development.
Dataset Source:
https://www.kaggle.com/datasets/abdullahmeo/world-cost-of-living-and-quality-of-life-20242025
This project will evolve into an AI-powered relocation platform with intelligent agents for personalized relocation planning.
Proprietary / All Rights Reserved
This repository is shared for portfolio purposes only.
Puja Kumari
🐦 X (Twitter): https://x.com/pujakumaricodes
💼 LinkedIn: https://www.linkedin.com/in/betterversionofpuja
📧 Email: betterversionofpuja@gmail.com
If you found this project useful or interesting, consider giving it a ⭐ on GitHub.
It helps others discover the project and motivates me to continue building and improving it.