This is the seventh project for freeCodeCamp's Data Visualization certificate.
Completed On: 10 August 2017
Build an app that is functionally similar to this: https://codepen.io/FreeCodeCamp/full/ONxvaa/.
Fulfill the below user stories. Use whichever libraries or APIs you need. Give it your own personal style.
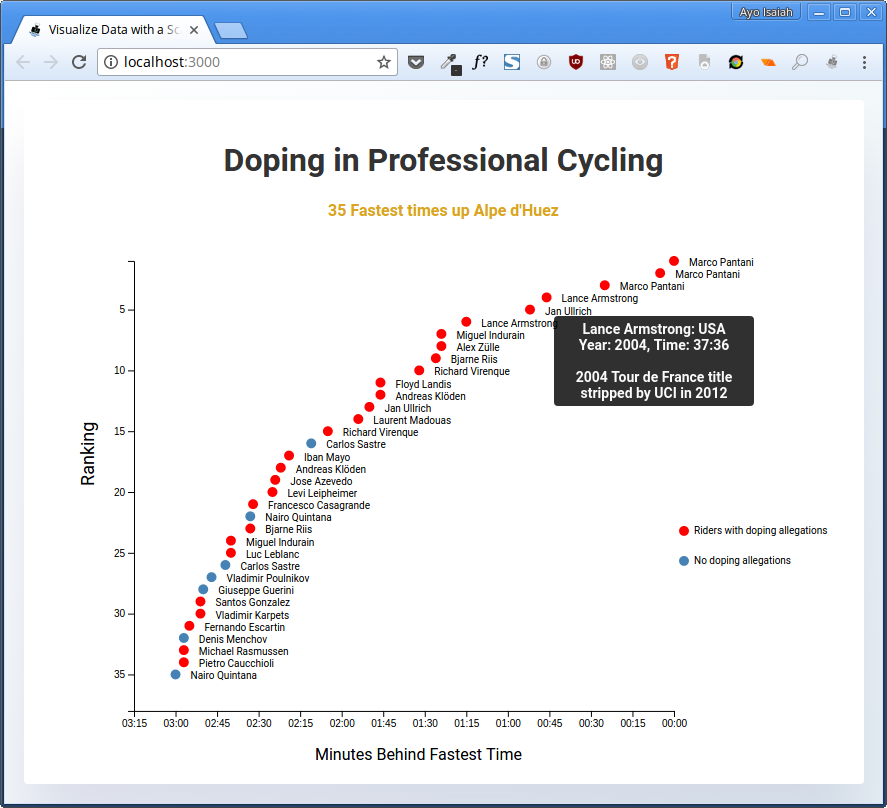
- I can see performance time visualized in a scatterplot graph.
- I can mouse over a plot to see a tooltip with additional details.
Hint: Here's a dataset you can use to build this: https://raw.githubusercontent.com/FreeCodeCamp/ProjectReferenceData/master/cyclist-data.json
https://codepen.io/ayoisaiah/full/jLwbZb/