An in-browser music streaming history visualizer built on Plotly.js and Bootstrap 5.
https://attilakillin.github.io/spotify-visualizer-2
Runs completely locally, in the browser, no backend is needed.
Both Spotify and Apple Music provide ways to download your data, which includes your streaming history in a structured format (either JSON or CSV). This application parses the streaming data downloaded from either platform, and visualizes your habits in a number of ways.
Across all your streams, how much music did you listen to in any one hour of an average day? The dataset is assumed to contain all data between a minimum and a maximum timestamp (be it a few days, months, or years), and as such, the average is calculated using the time difference between these two timestamps.

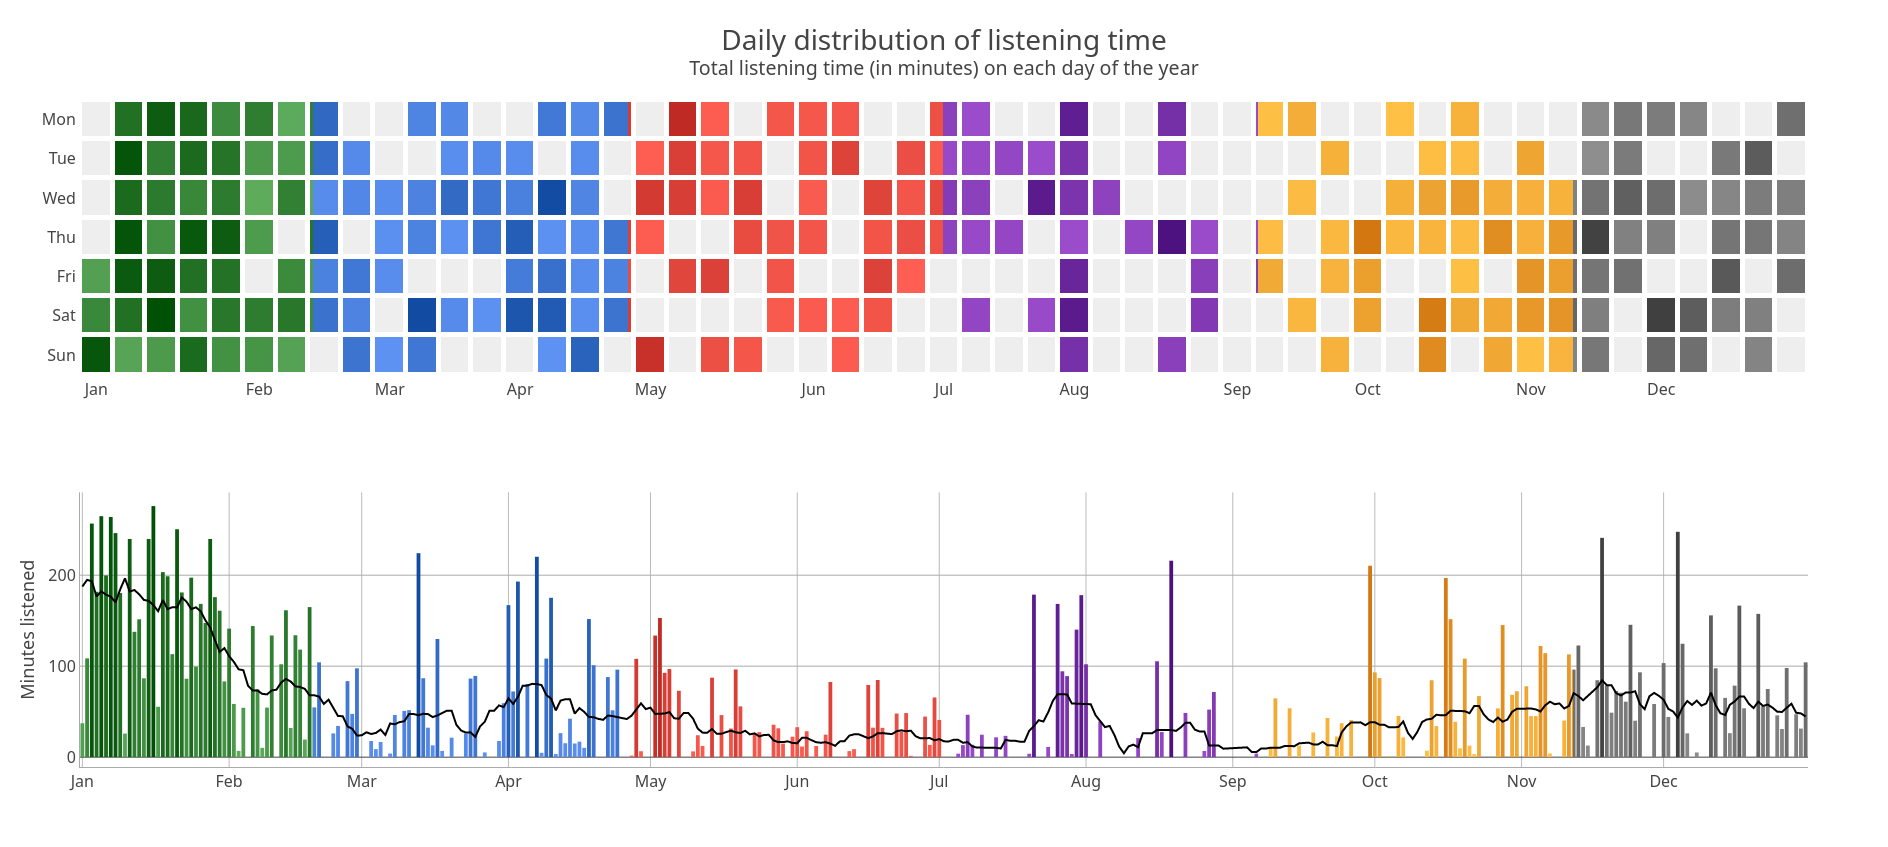
Across all your streams, how much music did you listen to on each specific day of the year? The whole dataset is mapped, even if it covers more than one year in time. Overlapping days from different years are displayed in the same cell, with their values added.
To get the most out of this visualization, use a dataset that only covers a single year or less.

See your top songs and artists in a sortable, browseable way.
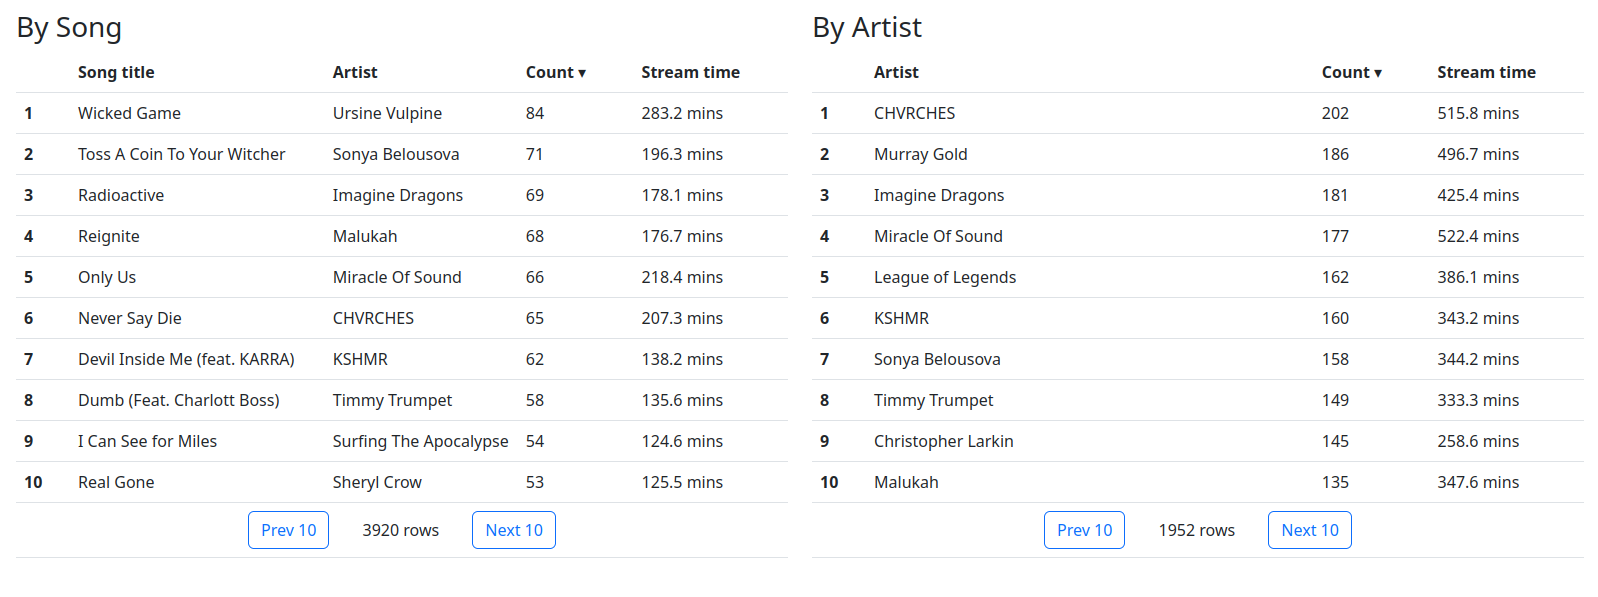
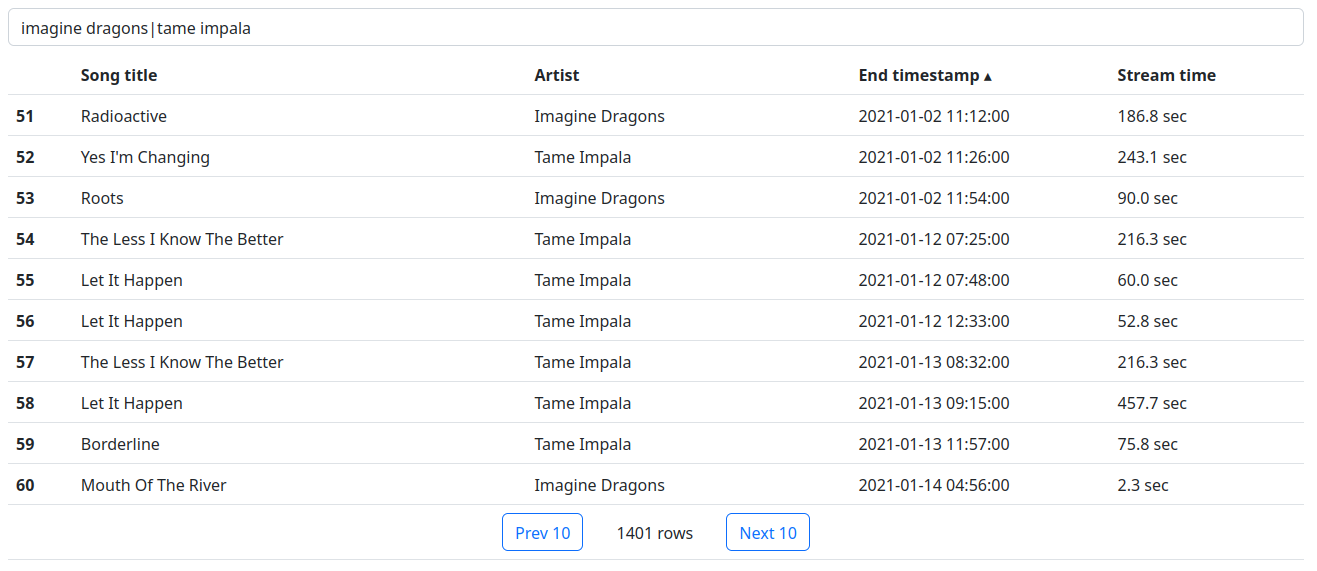
If you want to sort, filter, or browse your uploaded dataset, there's a view to do just that. Sort your data by title, artist, end timestamp, or streaming time, as well as filter them by any valid regular expression (or, by extension, literal query).
Everything is better with a little variety! To change the color of the graphs, simply select your preferred choice in the upper right corner and the graphs will update instantly.
Each graph is color coded with subtle shade differences in the base color, with darker colors meaning higher values.
As requesting the data can take a few days, there's a sample JSON file in the repository that you can use to test the website's functionality.
The goal of this project was to provide additional insight into my listening habits above the basic top 10 lists that Spotify compiles for you in Spotify Wrapped. A year ago, I wrote a similar parser in R, but because of the R environment, quickly deploying the application anywhere proved difficult.
In the current project, I self-imposed some constraints:
- The project needs to be written as a web application to ease portability and accessability.
- The application has to run in itself, locally, without any backend or server to communicate with.
- The application source must be able to run as is, without any compilation before deployment.
- The interface needs to be intuitive and responsive.
As such, the whole site is a self-contained HTML file, with its logic separated in a few JS scripts. The three required libraries (Bootstrap, Plotly.js, and D3.js) are downloaded from CDNs when the main HTML file is loaded.