Multi axis line chart yaxis negative bug #41
Description
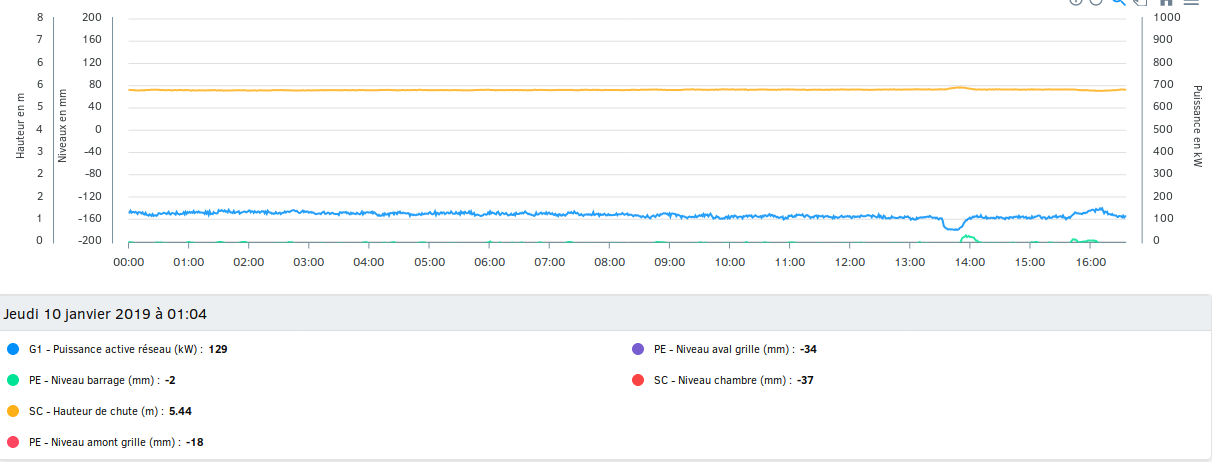
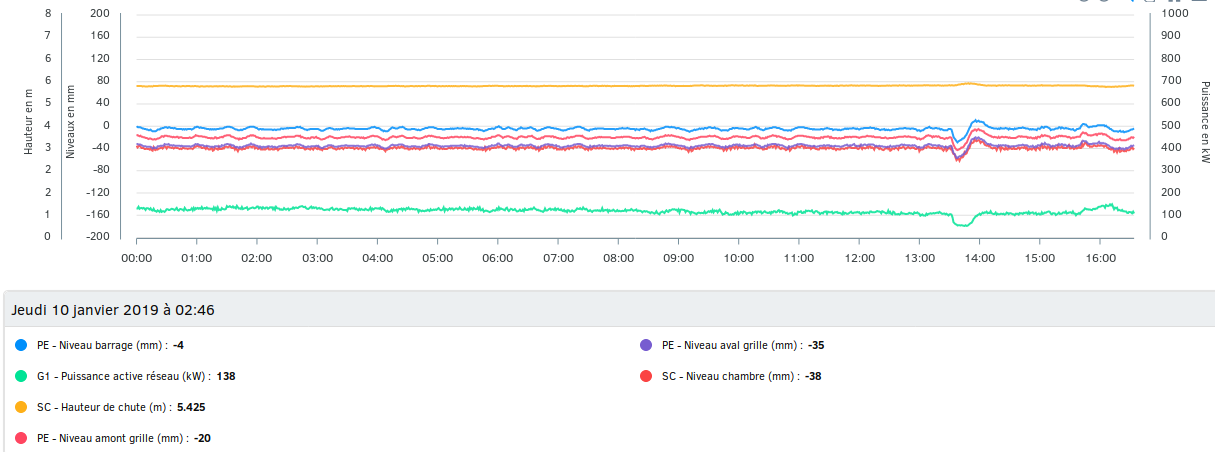
If you dynamically add data with negative axis (like from -200 to 200) and don't put them first in the order of the axis, the lines draw like the 0 is at the bottom. It works well if the axis are sorted by axis_min. I can't provide a codepen as of now but will add it later.
First axis and data is a 0 to positive axis :
With axis and data sorted by axis min :
I suppose this is a minor forget somewhere but I'm willing to build up a codepen if needed.