Zooming with sync charts makes yaxis borders appear #650
Description
Codesandbox: https://codesandbox.io/s/react-apex-chart-83wbh
I have two synced charts, one of those has the borders hidden for multiple series. The main issue is that when I zoom in any of the charts, the hidden property seems to disappear and the borders are shown.
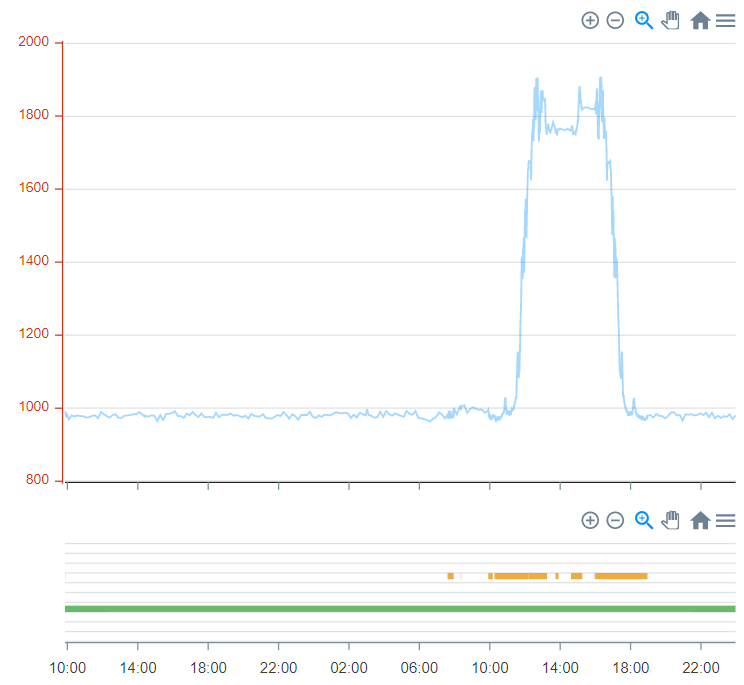
This is how the chart initially looks:
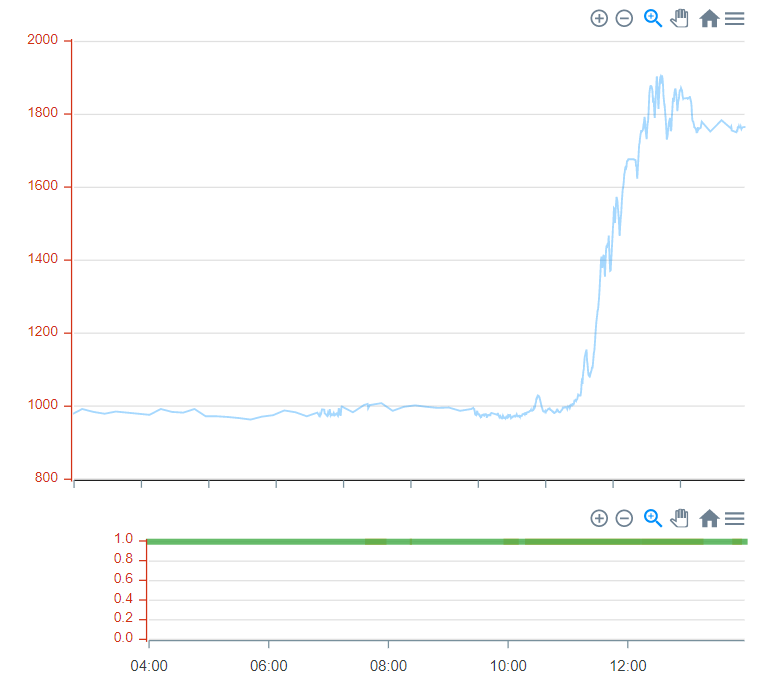
If I use the zoom in the bigger chart it ends up like this:
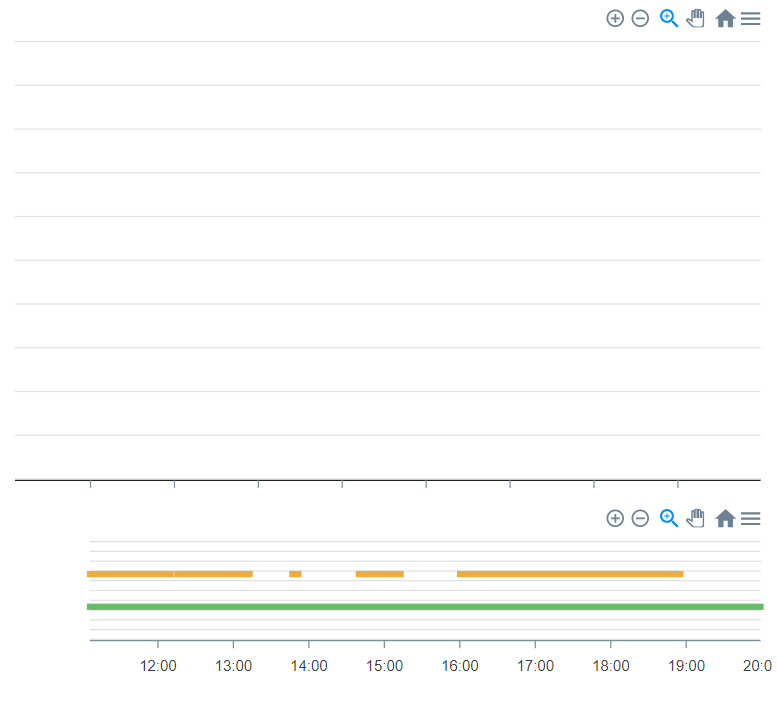
If I use the zoom in the smaller chart it ends up like this:
It also breaks using the pan tool.
Funny thing is that this issue wasn't happening in the 3.6.8 version.
Is there any workaround for this?