Treemap chart does not render when series is updated #2356
Description
I am using the treemap chart for a project.
Firstly, I have no data in my chart, then I generate the first dataset / update on button press. This is how everything is configured so far:
  chart: ApexCharts;
  chartData: any[] = [];
  chartOptions: Partial<ChartOptions>;
In the constructor I initialize the chartOptions:
this.chartOptions = {
series: [
{
data: this.chartData
}
],
legend: {
show: false
},
title: {
text: "Distribution of time estimates",
align: "center"
},
chart: {
height: 400,
type: "treemap",
},
colors: [],
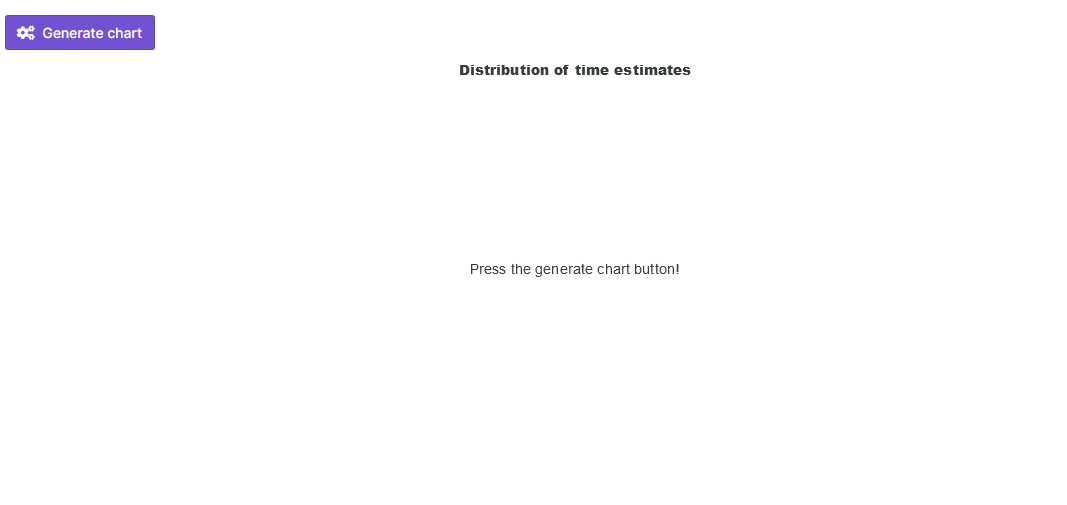
noData: {
text: 'Press the generate chart button!'
},
plotOptions: {
treemap: {
distributed: true,
enableShades: false
}
}
};
Then I initialize the chart in a separate function, on OnInit():
this.chart = new ApexCharts(document.querySelector('#chart'), this.chartOptions);
this.chart.render();
The chart is being displayed without a problem, as expected.
Then, when pressing the Generate chart button, I do the following actions:
     this.chartData = this.myListOfObjects.map(p => ({
      x: p.name, //string
      y: p..estimatedTime //number
    }));

    let chartColors = [];

    //dont mind this, here is some code to generate better random colors
    for (let i = 0; i < this.chartData.length; i++) {
      const h = Math.random();
      chartColors.push(HSVtoHEX(h, 0.6, 0.95));
    }

    this.chartOptions.series = [{
      data: this.chartData
    }];

    this.chartOptions.colors = chartColors;
    this.chart.updateOptions(this.chartOptions);

    this.chart.updateSeries([{
      name: 'Time Estimates',
      data: this.chartData
    }]);
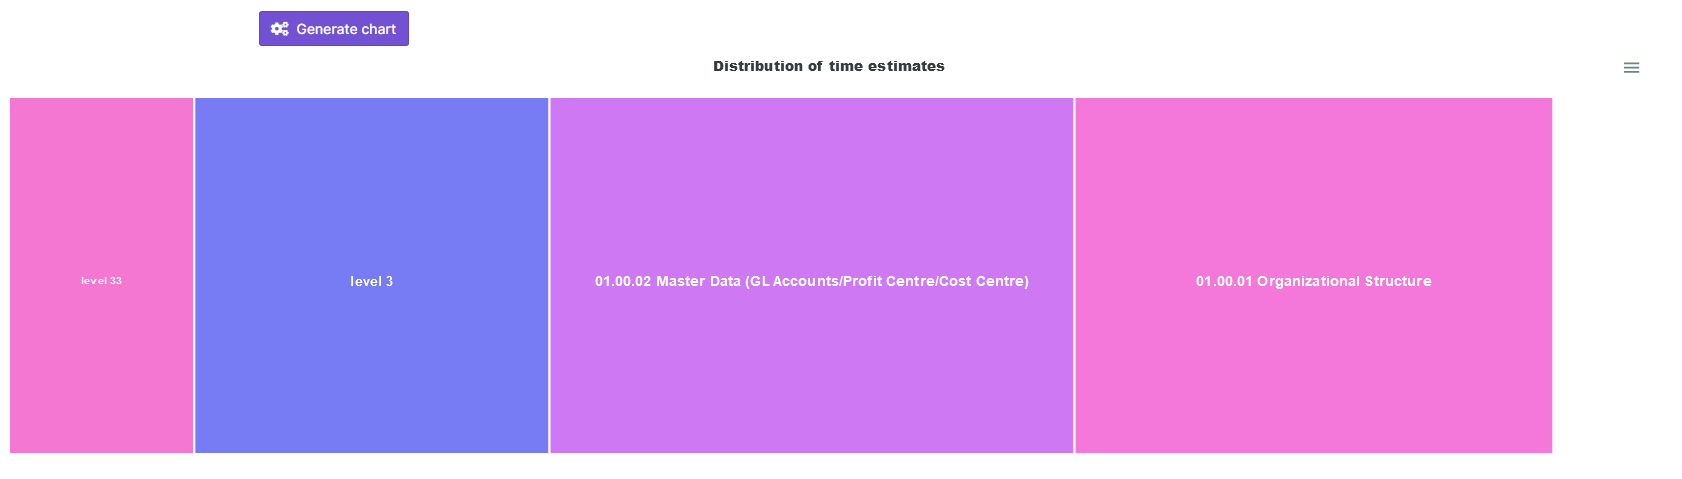
Now is where the fun part begins: I receive a console error which says:
TypeError: can't access property 0, i.globals.previousPaths[o] is undefined
The chart looks like this at this stage:

Each time I call this method, the same error appears.
If I resize the window, the chart appears as it should and my update method works.
What am I doing wrong? Am I misusing the library?
I am using Angular 11 and the latest version of apex-charts.
EDIT - this is my html code:
           <div id="chart" >
                <apx-chart [series]="chartOptions.series" [chart]="chartOptions.chart"
                    [dataLabels]="chartOptions.dataLabels" [plotOptions]="chartOptions.plotOptions"
                    [title]="chartOptions.title" [colors]="chartOptions.colors" [noData]="chartOptions.noData">
                </apx-chart>
            </div>