Does Mixed Chart - Candlestick and Scatter - has no ability to move candlestick chart in and out ? #1840
Description
Event content
ApexChart itself vanished when I moved candlestick chart out of svg-tag by clicking the legend under the chart.
And then, I got following error on browser console. (Uncaught (in promise) TypeError: Cannot read property 'y' of undefined)
Uncaught (in promise) TypeError: Cannot read property 'y' of undefined
    at t.value (apexcharts.common.js:6)
    at t.value (apexcharts.common.js:6)
    at t.value (apexcharts.common.js:6)
    at t.value (apexcharts.common.js:6)
    at t.value (apexcharts.common.js:14)
    at t.create (apexcharts.common.js:6)
    at apexcharts.common.js:14
    at new Promise (<anonymous>)
    at t.value (apexcharts.common.js:14)
    at i.value (apexcharts.common.js:6)
    at t.value (apexcharts.common.js:6)
    at t.value (apexcharts.common.js:6)
    at t.value (apexcharts.common.js:6)
Image
The image before click is below.
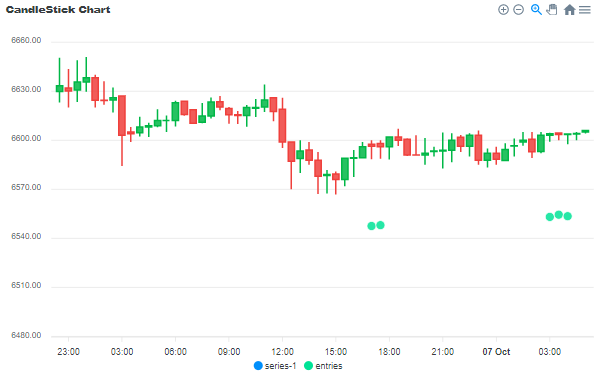
I clicked the legend 'entries' 'series-1'.
Version
    "apexcharts": "3.20.0",
    "react-apexcharts": "1.3.7",
Source
The source code is below.
/* src/App.js */
import React, { Component } from 'react';
import SampleChart from './SampleChart';

class App extends Component {
  constructor(props) {
    super(props)
  }

  render() {
    return (
      <>
        <SampleChart />
      </>
    );
  }
}

export default App;
/* src/SampleChart.js */
import React, { Component } from 'react';
import ReactApexChart from 'react-apexcharts'
import * as apexHelper from './models/apexHelper'
class SampleChart extends Component {
constructor(props) {
super(props);
this.state = {
options: {
chart: {
type: 'scatter',
height: 350
},
legend: {
// show: false
},
title: {
text: 'CandleStick Chart',
align: 'left'
},
xaxis: {
type: 'datetime'
},
yaxis: {
forceNiceScale: true,
tooltip: {
intersect: true,
enabled: true
},
min: 6500
}
},
series: [{
name: 'series-1',
type: 'candlestick',
data: apexHelper.toCandlesSource(apexHelper.rawData)
}, {
name: 'entries',
type: 'scatter',
data: apexHelper.toEntriesSource(apexHelper.dots)
}]
}
}
render() {
return (
/* <Chart options={this.state.options} series={this.state.series} type="bar" width={500} height={320} /> */
<div id="chart">
<ReactApexChart options={this.state.options} series={this.state.series} type="scatter" width={800} />
</div>
)
}
}
export default SampleChart;/* src/models/apexHelper.js */
export const toCandlesSource = function (dfRows) {
return dfRows.map(function(row) {
return { x: row.time, y: [row.o, row.h, row.l, row.c] }
});
}
export const toEntriesSource = function (dfRows) {
return dfRows.map(function(row) { return { x: row.time, y: row.entry }; });
}
/* ---------------------
Sample Data
--------------------- */
export const rawData = [
{ time: new Date(1538778600000), o: 6629.81, h: 6650.5, l: 6623.04, c: 6633.33 },
{ time: new Date(1538780400000), o: 6632.01, h: 6643.59, l: 6620, c: 6630.11 },
{ time: new Date(1538782200000), o: 6630.71, h: 6648.95, l: 6623.34, c: 6635.65},
{ time: new Date(1538784000000), o: 6635.65, h: 6651, l: 6629.67, c: 6638.24 },
{ time: new Date(1538785800000), o: 6638.24, h: 6640, l: 6620, c: 6624.47 },
{ time: new Date(1538787600000), o: 6624.53, h: 6636.03, l: 6621.68, c: 6624.31 },
{ time: new Date(1538789400000), o: 6624.61, h: 6632.2, l: 6617, c: 6626.02 },
{ time: new Date(1538791200000), o: 6627, h: 6627.62, l: 6584.22, c: 6603.02 },
{ time: new Date(1538793000000), o: 6605, h: 6608.03, l: 6598.95, c: 6604.01 },
{ time: new Date(1538794800000), o: 6604.5, h: 6614.4, l: 6602.26, c: 6608.02 },
{ time: new Date(1538796600000), o: 6608.02, h: 6610.68, l: 6601.99, c: 6608.91 },
{ time: new Date(1538798400000), o: 6608.91, h: 6618.99, l: 6608.01, c: 6612 },
{ time: new Date(1538800200000), o: 6612, h: 6615.13, l: 6605.09, c: 6612 },
{ time: new Date(1538802000000), o: 6612, h: 6624.12, l: 6608.43, c: 6622.95 },
{ time: new Date(1538803800000), o: 6623.91, h: 6623.91, l: 6615, c: 6615.67 },
{ time: new Date(1538805600000), o: 6618.69, h: 6618.74, l: 6610, c: 6610.4 },
{ time: new Date(1538807400000), o: 6611, h: 6622.78, l: 6610.4, c: 6614.9 },
{ time: new Date(1538809200000), o: 6614.9, h: 6626.2, l: 6613.33, c: 6623.45 },
{ time: new Date(1538811000000), o: 6623.48, h: 6627, l: 6618.38, c: 6620.35 },
{ time: new Date(1538812800000), o: 6619.43, h: 6620.35, l: 6610.05, c: 6615.53 },
{ time: new Date(1538814600000), o: 6615.53, h: 6617.93, l: 6610, c: 6615.19 },
{ time: new Date(1538816400000), o: 6615.19, h: 6621.6, l: 6608.2, c: 6620 },
{ time: new Date(1538818200000), o: 6619.54, h: 6625.17, l: 6614.15, c: 6620 },
{ time: new Date(1538820000000), o: 6620.33, h: 6634.15, l: 6617.24, c: 6624.61 },
{ time: new Date(1538821800000), o: 6625.95, h: 6626, l: 6611.66, c: 6617.58 },
{ time: new Date(1538823600000), o: 6619, h: 6625.97, l: 6595.27, c: 6598.86 },
{ time: new Date(1538825400000), o: 6598.86, h: 6598.88, l: 6570, c: 6587.16 },
{ time: new Date(1538827200000), o: 6588.86, h: 6600, l: 6580, c: 6593.4 },
{ time: new Date(1538829000000), o: 6593.99, h: 6598.89, l: 6585, c: 6587.81 },
{ time: new Date(1538830800000), o: 6587.81, h: 6592.73, l: 6567.14, c: 6578 },
{ time: new Date(1538832600000), o: 6578.35, h: 6581.72, l: 6567.39, c: 6579 },
{ time: new Date(1538834400000), o: 6579.38, h: 6580.92, l: 6566.77, c: 6575.96 },
{ time: new Date(1538836200000), o: 6575.96, h: 6589, l: 6571.77, c: 6588.92 },
{ time: new Date(1538838000000), o: 6588.92, h: 6594, l: 6577.55, c: 6589.22 },
{ time: new Date(1538839800000), o: 6589.3, h: 6598.89, l: 6589.1, c: 6596.08 },
{ time: new Date(1538841600000), o: 6597.5, h: 6600, l: 6588.39, c: 6596.25 },
{ time: new Date(1538843400000), o: 6598.03, h: 6600, l: 6588.73, c: 6595.97 },
{ time: new Date(1538845200000), o: 6595.97, h: 6602.01, l: 6588.17, c: 6602 },
{ time: new Date(1538847000000), o: 6602, h: 6607, l: 6596.51, c: 6599.95 },
{ time: new Date(1538848800000), o: 6600.63, h: 6601.21, l: 6590.39, c: 6591.02 },
{ time: new Date(1538850600000), o: 6591.02, h: 6603.08, l: 6591, c: 6591 },
{ time: new Date(1538852400000), o: 6591, h: 6601.32, l: 6585, c: 6592 },
{ time: new Date(1538854200000), o: 6593.13, h: 6596.01, l: 6590, c: 6593.34 },
{ time: new Date(1538856000000), o: 6593.34, h: 6604.76, l: 6582.63, c: 6593.86 },
{ time: new Date(1538857800000), o: 6593.86, h: 6604.28, l: 6586.57, c: 6600.01 },
{ time: new Date(1538859600000), o: 6601.81, h: 6603.21, l: 6592.78, c: 6596.25 },
{ time: new Date(1538861400000), o: 6596.25, h: 6604.2, l: 6590, c: 6602.99 },
{ time: new Date(1538863200000), o: 6602.99, h: 6606, l: 6584.99, c: 6587.81 },
{ time: new Date(1538865000000), o: 6587.81, h: 6595, l: 6583.27, c: 6591.96 },
{ time: new Date(1538866800000), o: 6591.97, h: 6596.07, l: 6585, c: 6588.39 },
{ time: new Date(1538868600000), o: 6587.6, h: 6598.21, l: 6587.6, c: 6594.27 },
{ time: new Date(1538870400000), o: 6596.44, h: 6601, l: 6590, c: 6596.55 },
{ time: new Date(1538872200000), o: 6598.91, h: 6605, l: 6596.61, c: 6600.02 },
{ time: new Date(1538874000000), o: 6600.55, h: 6605, l: 6589.14, c: 6593.01 },
{ time: new Date(1538875800000), o: 6593.15, h: 6605, l: 6592, c: 6603.06 },
{ time: new Date(1538877600000), o: 6603.07, h: 6604.5, l: 6599.09, c: 6603.89 },
{ time: new Date(1538879400000), o: 6604.44, h: 6604.44, l: 6600, c: 6603.5 },
{ time: new Date(1538881200000), o: 6603.5, h: 6603.99, l: 6597.5, c: 6603.86 },
{ time: new Date(1538883000000), o: 6603.85, h: 6605, l: 6600, c: 6604.07 },
{ time: new Date(1538884800000), o: 6604.98, h: 6606, l: 6604.07, c: 6606 },
]
export const dots = [
{ time: new Date(1538841600000), entry: 6547.5, exit: 6700 },
{ time: new Date(1538843400000), entry: 6548.03, exit: 6700 },
{ time: new Date(1538877600000), entry: 6553.07, exit: 6704.5 },
{ time: new Date(1538879400000), entry: 6554.44, exit: 6704.44 },
{ time: new Date(1538881200000), entry: 6553.5, exit: 6703.99 },
]Is My source wrong ?
Cannot Candlestick be used in combination with other chart ?
Addendum
If I clicked the legend title of 'entries' before clicking the one of 'series-1', the perfomance was normal - only Scatter was moved out of chart.
And if after that, I could move out candlestick chart in and out.