showDuplicates disrupts the graph rendering #1729
Description
Bug report
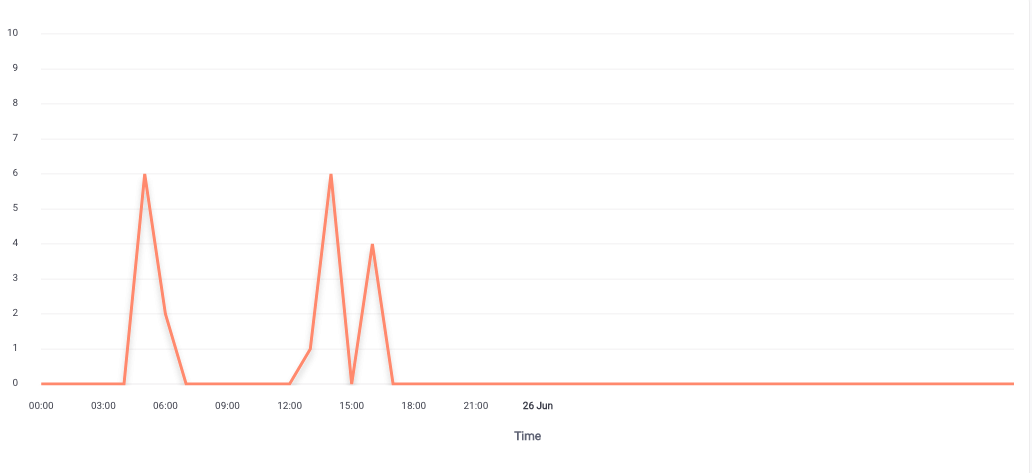
When passing the following series and showDuplicates is enabled in xaxis options. It does not show the ticks.
Categories:
["2020-06-24 20:00:00", "2020-06-24 21:00:00", "2020-06-24 22:00:00", "2020-06-24 23:00:00", "2020-06-25 00:00:00", "2020-06-25 01:00:00", "2020-06-25 02:00:00", "2020-06-25 03:00:00", "2020-06-25 04:00:00", "2020-06-25 05:00:00", "2020-06-25 06:00:00", "2020-06-25 07:00:00", "2020-06-25 08:00:00", "2020-06-25 09:00:00", "2020-06-25 10:00:00", "2020-06-25 11:00:00", "2020-06-25 12:00:00", "2020-06-25 13:00:00", "2020-06-25 14:00:00", "2020-06-25 15:00:00", "2020-06-25 16:00:00", "2020-06-25 17:00:00", "2020-06-25 18:00:00", "2020-06-25 19:00:00", "2020-06-25 20:00:00", "2020-06-25 21:00:00", "2020-06-25 22:00:00", "2020-06-25 23:00:00", "2020-06-26 00:00:00", "2020-06-26 01:00:00", "2020-06-26 02:00:00", "2020-06-26 03:00:00", "2020-06-26 04:00:00", "2020-06-26 05:00:00", "2020-06-26 06:00:00", "2020-06-26 07:00:00", "2020-06-26 08:00:00", "2020-06-26 09:00:00", "2020-06-26 10:00:00", "2020-06-26 11:00:00", "2020-06-26 12:00:00", "2020-06-26 13:00:00", "2020-06-26 14:00:00", "2020-06-26 15:00:00", "2020-06-26 16:00:00", "2020-06-26 17:00:00", "2020-06-26 18:00:00", "2020-06-26 19:00:00"]
Series:
[{data: [0, 0, 0, 0, 0, 6, 2, 0, 0, 0, 0, 0, 0, 1, 6, 0, 4, 0, 0, 0, 0, 0, 0, 0, 0, 0, 0, 0, 0, 0, 0, 0, 0, 0, 0, 0, 0, 0, 0, 0, 0, 0, 0, 0, 0, 0, 0, 0], name: 'Total'}]
My options:
xaxis: {
  ...
  'labels': {
            'datetimeUTC': true,
            'show': true,
            'rotate': -45,
            'rotateAlways': false,
            'hideOverlappingLabels': true,
            'showDuplicates': false // Even if its false, it shows bad graph, so i ended up commenting the line
   },
  ...
}
Codepen
Modify this codepen to demonstrate the problem clearly, just fork it and paste the resulting codepen in your issue. Please make sure this is a minimal example, containing only the minimum necessary code to help us troubleshoot your problem. Issues/bug reports without reproducible example will be given least priority, so make sure you include one.
If you are using vue-apexcharts, and want to create a demo in Vue environment, use CodeSandbox Vue template
If you are using react-apexcharts, and want to create a demo in React environment, use CodeSandbox React template
Explanation
- What is the behavior you expect?
To show all the ticks - What is happening instead?
It shows incomplete ticks on xaxis - What error message are you getting?
No errors on console, the Graph has incomplete xaxis ticks