VueJs integration - Empty stacked column chart #1617
Description
Bug report
Codepen
You can check this https://codesandbox.io/s/vue-empty-stacked-bar-chart-vznud this reproduce the issue.
Explanation
I have created a pretty simple stacked bar chart in my VueJs App:
options: {
  chart: {
    id: 'graph-cash-flow',
    stacked: true,
    zoom: false,
    toolbar: {
      show: false,
    },
  },
  dataLabels: {
    enabled: false,
  },
  xaxis: {
    type: 'datetime',
    labels: {
      format: 'yyyy-MM-dd',
    },
  },
},
When using a sample date, the columns are displayed correctly (well, actually I miss the first date 2020-04-01 but this is another topic).

series: [{
  name: 'Food',
  data: [
    {
      x: '2020-04-01',
      y: 30,
    },
    {
      x: '2020-04-02',
      y: 12,
    },
    {
      x: '2020-04-03',
      y: 5,
    },
    {
      x: '2020-04-04',
      y: 60,
    },
    {
      x: '2020-04-05',
      y: 40,
    },
  ],
}, {
  name: 'Shopping',
  data: [
    {
      x: '2020-04-01',
      y: 10,
    },
    {
      x: '2020-04-02',
      y: 40,
    },
    {
      x: '2020-04-03',
      y: 30,
    },
    {
      x: '2020-04-04',
      y: 40,
    },
    {
      x: '2020-04-05',
      y: 20,
    },
  ],
}, {
  name: 'Sports',
  data: [
    {
      x: '2020-04-01',
      y: 20,
    },
    {
      x: '2020-04-02',
      y: 20,
    },
    {
      x: '2020-04-03',
      y: 5,
    },
    {
      x: '2020-04-04',
      y: -50,
    },
    {
      x: '2020-04-05',
      y: 10,
    },
  ],
}, {
  name: 'Entertainment',
  data: [
    {
      x: '2020-04-01',
      y: 10,
    },
    {
      x: '2020-04-02',
      y: 40,
    },
    {
      x: '2020-04-03',
      y: 5,
    },
    {
      x: '2020-04-04',
      y: 60,
    },
    {
      x: '2020-04-05',
      y: 40,
    },
  ],
}],
But now with real data for some reasons the columns are not displayed ... I have no console errors. And if I put different values I can see the y-axis being updated to fin min/max values. Did I miss something?
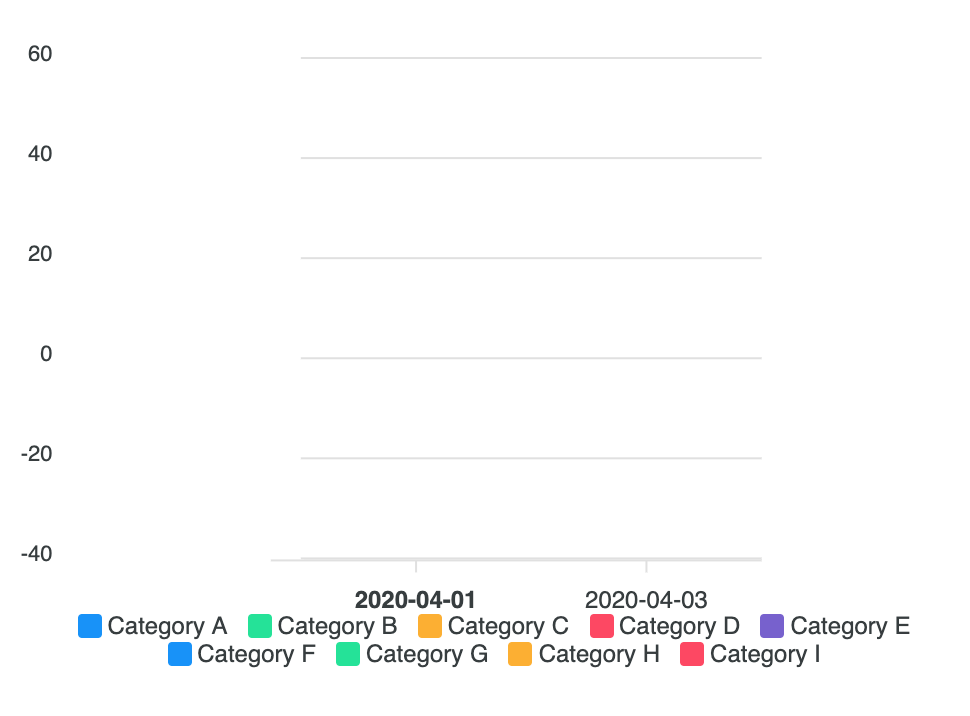
series: [
  {
    name: "Category A",
    data: [
      {
        x: "2020-04-02",
        y: -20
      }
    ]
  },
  {
    name: "Category B",
    data: [
      {
        x: "2020-04-02",
        y: -10
      }
    ]
  },
  {
    name: "Category C",
    data: [
      {
        x: "2020-04-02",
        y: -5
      }
    ]
  },
  {
    name: "Category D",
    data: [
      {
        x: "2020-04-02",
        y: 0
      }
    ]
  },
  {
    name: "Category E",
    data: [
      {
        x: "2020-04-02",
        y: 5
      }
    ]
  },
  {
    name: "Category F",
    data: [
      {
        x: "2020-04-02",
        y: 10
      }
    ]
  },
  {
    name: "Category G",
    data: [
      {
        x: "2020-04-02",
        y: 20
      }
    ]
  },
  {
    name: "Category H",
    data: [
      {
        x: "2020-04-02",
        y: 10
      }
    ]
  },
  {
    name: "Category I",
    data: [
      {
        x: "2020-04-02",
        y: 5
      }
    ]
  }
]
Thanks !