Always have the fill below the curve in area charts #1472
Description
I'm creating trend line widgets, showing the angle of the current trend line (another request btw) for a given time period. Some chart values are however negative and that makes the chart "flip" the area or even worse, cross the line. Like in this codepen:
https://codepen.io/jkohlin/pen/BaNgbOy
What I want is an option for fill that might look like this:
fill: {
  colors: '#0000ff',
  opacity: 0.9,
  type: 'gradient',
  fillTo: -20,
}
Where fillTo is a numeric value that, if set, forces the fill to flow all the way down to that value on the y-axis.
Then you could get this:
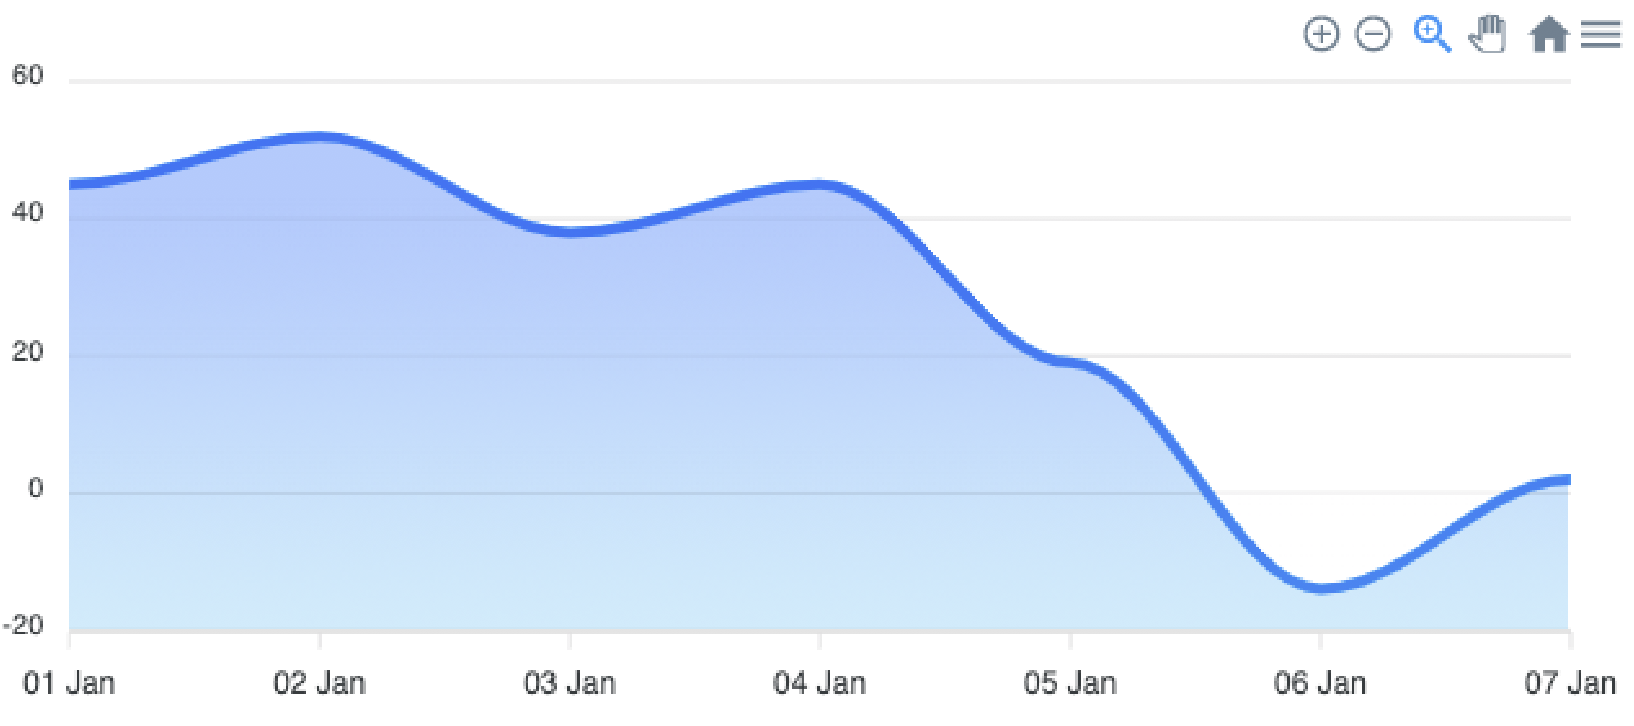
instead of this:
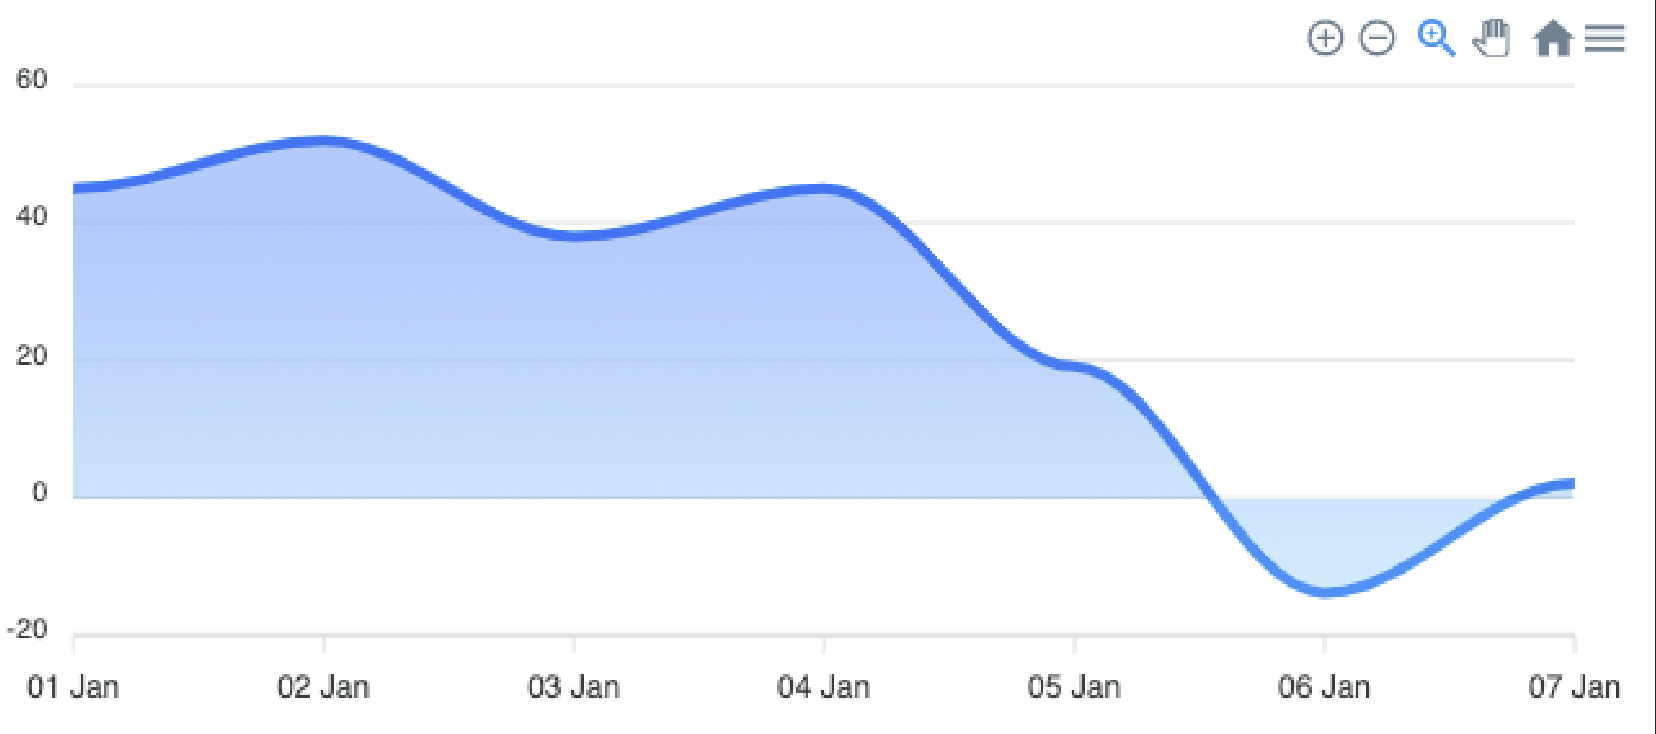
Describe alternatives you've considered
At the moment I have to recalculate the y values and add a positive value big enough to force the curve above zero. This works on sparklines, where the y-axis is hidden, but not otherwise of course.
This would be an awesome feature!