Data messing up with negative values in stacked area graph #1372
Description
Bug report
Codepen
Please look at this codepen.
Explanation
- What is the behavior you expect:
When removing a serie from the visualisation by clicking on it on the legend, the value of this serie is disapearing but the result data on the graph is wrong. - What is happening instead:
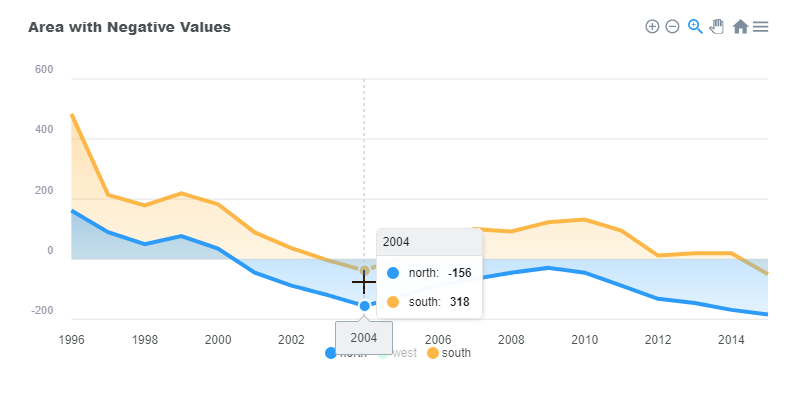
If I click on 'west', the graph is showing data for 'north' and 'south' but the graph is not in line anymore with the real data: in 2004 the sum of south (318) and north (-156) is 162 but the graph is showing negative value for the total.