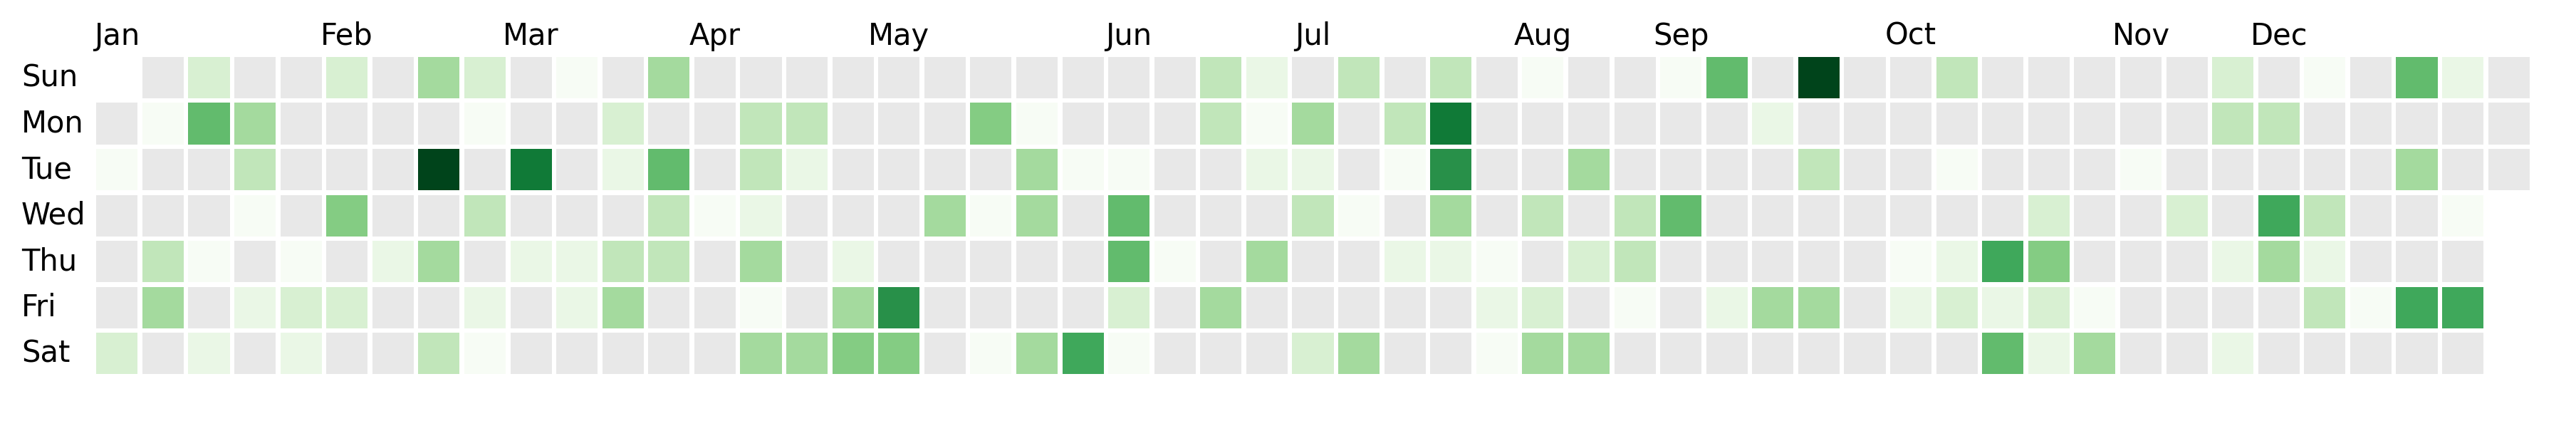
A simple-to-use Python library to build calendar heatmaps with ease.
It's built on top of matplotlib and leverages it to access high customization possibilities.
import matplotlib.pyplot as plt
import dayplot as dp

df = dp.load_dataset()  # requires pandas to be installed

fig, ax = plt.subplots(figsize=(15, 6))
dp.calendar(
    dates=df["dates"],
    values=df["values"],
    start_date="2024-01-01",
    end_date="2024-12-31",
    ax=ax,
)
More examples in the documentation.

pip install dayplotdayplot is designed to fit any matplotlib graph, allowing you to do things like:
