Update debug-javascript.md documentation #423
+80
−63
There are no files selected for viewing
This file contains hidden or bidirectional Unicode text that may be interpreted or compiled differently than what appears below. To review, open the file in an editor that reveals hidden Unicode characters.
Learn more about bidirectional Unicode characters
| Original file line number | Diff line number | Diff line change | ||||
|---|---|---|---|---|---|---|
| @@ -0,0 +1,80 @@ | ||||||
| # Using Your Browser to Diagnose JavaScript Errors | ||||||
|
|
||||||
| Interactive functionality in WordPress often relies on JavaScript. If you encounter broken menus, metaboxes that won’t drag, or buttons that don’t work (such as **Add Media**), these may be caused by JavaScript errors or conflicts. | ||||||
|
|
||||||
| This guide explains how to use your browser to diagnose JavaScript issues so you can provide better information when requesting support. | ||||||
|
|
||||||
| --- | ||||||
|
|
||||||
| ## Step 1: Try Another Browser {#try-another-browser} | ||||||
|
|
||||||
| Different browsers sometimes handle JavaScript differently. Test your site in at least two browsers: | ||||||
|
|
||||||
| - **If the issue only occurs in one browser** → it may be browser‑specific (e.g., an extension conflict). | ||||||
| - **If the issue occurs in all browsers** → it is likely a JavaScript or plugin/theme error. | ||||||
|
|
||||||
| 👉 Note: Browser extensions (ad blockers, privacy tools) can sometimes interfere with JavaScript. Try disabling extensions or using a private/incognito window to rule this out. | ||||||
|
There was a problem hiding this comment. Is there convention for highlighting a sentence with an emoji like this in the WP documentation? I don't recall seeing one. If not, I recommend we don't start doing it here and just make the note intro bold.
Suggested change
|
||||||
|
|
||||||
| Record which browsers show the error; include this information in your support request. | ||||||
|
|
||||||
| --- | ||||||
|
|
||||||
| ## Step 2: Enable SCRIPT_DEBUG {#enable-script-debug} | ||||||
|
|
||||||
| WordPress uses minified JavaScript by default. Enabling `SCRIPT_DEBUG` forces WordPress to load the full, uncompressed versions, which makes errors easier to trace. | ||||||
|
|
||||||
| 1. Open `wp-config.php`. | ||||||
| 2. Add this line **before** “That’s all, stop editing! Happy publishing”: | ||||||
|
|
||||||
| ```php | ||||||
| define( 'SCRIPT_DEBUG', true ); | ||||||
| ``` | ||||||
|
|
||||||
| 3. Reload your site and check if the error still occurs. | ||||||
|
|
||||||
| - **If the issue is fixed** → turn off `SCRIPT_DEBUG` again and report this detail in your support request. | ||||||
| - **If the issue persists** → continue to Step 3. | ||||||
|
|
||||||
| --- | ||||||
|
|
||||||
| ## Step 3: Open Browser Developer Tools {#open-devtools} | ||||||
|
|
||||||
| Every modern browser includes Developer Tools. Open them and switch to the **Console** tab. | ||||||
|
|
||||||
| - **Chrome / Edge / Opera**: Press **F12** (or `Ctrl+Shift+I` / `Cmd+Option+I`) → select the **Console** tab. | ||||||
| - **Firefox**: Press **F12** (or `Ctrl+Shift+K` / `Cmd+Option+K`) → **Console** tab. | ||||||
| - **Safari**: First enable the Develop menu: `Safari → Settings → Advanced → Show Develop menu`. Then open **Develop → Show JavaScript Console**. | ||||||
|
There was a problem hiding this comment. Some versions of macOS call the option "Show features for web developers" (same location). Also once enabled, Cmd+Option+I will open the console like other browsers. |
||||||
|
|
||||||
| --- | ||||||
|
|
||||||
| ## Step 4: Identify the Error {#identify-error} | ||||||
|
|
||||||
| Errors will appear in the Console. A typical error message might look like: | ||||||
|
|
||||||
| 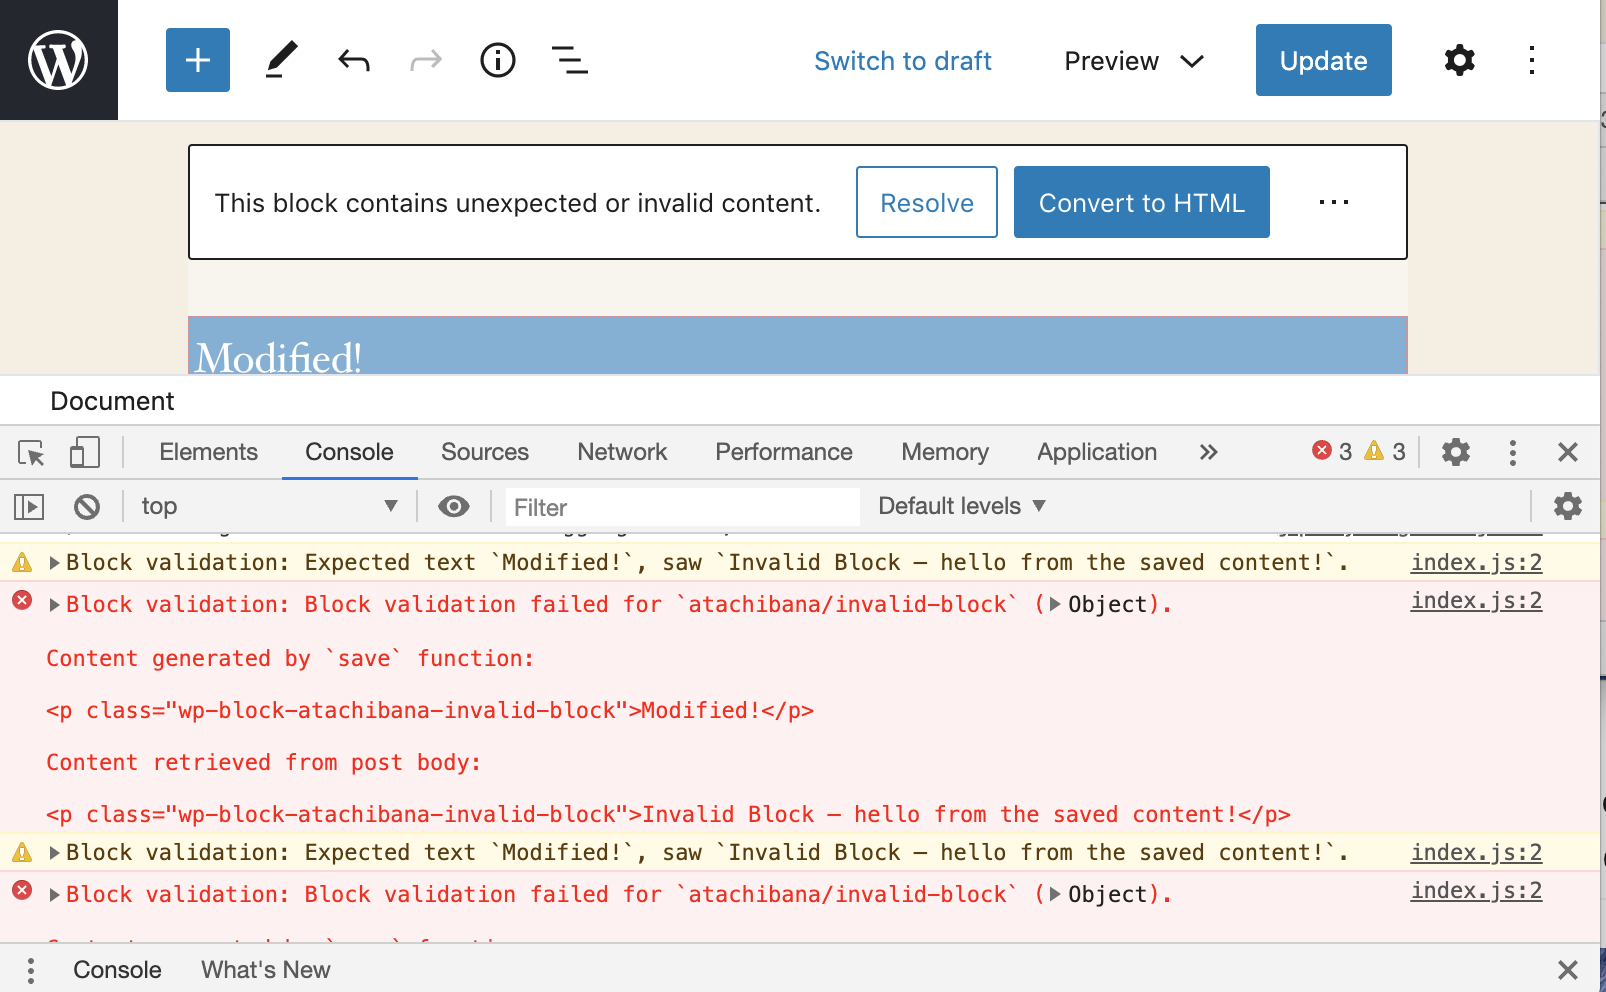 | ||||||
|
|
||||||
| Tips: | ||||||
| - Copy the **full error message and stack trace** (not just the line number). | ||||||
| - If no errors appear, reload the page — some only occur on load. | ||||||
| - Note the **file name and line number** of the error (e.g., `jquery.js:2`). | ||||||
|
|
||||||
| --- | ||||||
|
|
||||||
| ## Step 5: Report the Issue {#report} | ||||||
|
|
||||||
| When requesting help, provide as much detail as possible. Go to the [WordPress.org Support Forums](https://wordpress.org/support/forums/) or the plugin/theme’s dedicated forum: | ||||||
| - Plugins: `https://wordpress.org/support/plugin/PLUGINNAME` | ||||||
| - Themes: `https://wordpress.org/support/theme/THEMENAME` | ||||||
|
|
||||||
| Include the following information: | ||||||
| - Browsers where the error occurs | ||||||
| - Whether enabling `SCRIPT_DEBUG` changed the behavior | ||||||
| - The full JavaScript error message (including stack trace) | ||||||
| - File name and line number where the error occurred | ||||||
| - Context — what action triggered the error | ||||||
| - A link to the affected page, if possible | ||||||
|
|
||||||
| --- | ||||||
|
|
||||||
| ## Summary {#summary} | ||||||
| By confirming the issue across browsers, enabling `SCRIPT_DEBUG`, and checking the browser console, you can quickly diagnose JavaScript errors. Sharing this information in support requests makes it much easier for volunteers and developers to help resolve your problem. | ||||||
Add this suggestion to a batch that can be applied as a single commit.
This suggestion is invalid because no changes were made to the code.
Suggestions cannot be applied while the pull request is closed.
Suggestions cannot be applied while viewing a subset of changes.
Only one suggestion per line can be applied in a batch.
Add this suggestion to a batch that can be applied as a single commit.
Applying suggestions on deleted lines is not supported.
You must change the existing code in this line in order to create a valid suggestion.
Outdated suggestions cannot be applied.
This suggestion has been applied or marked resolved.
Suggestions cannot be applied from pending reviews.
Suggestions cannot be applied on multi-line comments.
Suggestions cannot be applied while the pull request is queued to merge.
Suggestion cannot be applied right now. Please check back later.
There was a problem hiding this comment.
Choose a reason for hiding this comment
The reason will be displayed to describe this comment to others. Learn more.
Was there a reason the original filename was changed for this new one?