A web-based tool for visualizing and analyzing radiosonde flight data from log files generated by the Radiosonde decoder by 9A4AM.
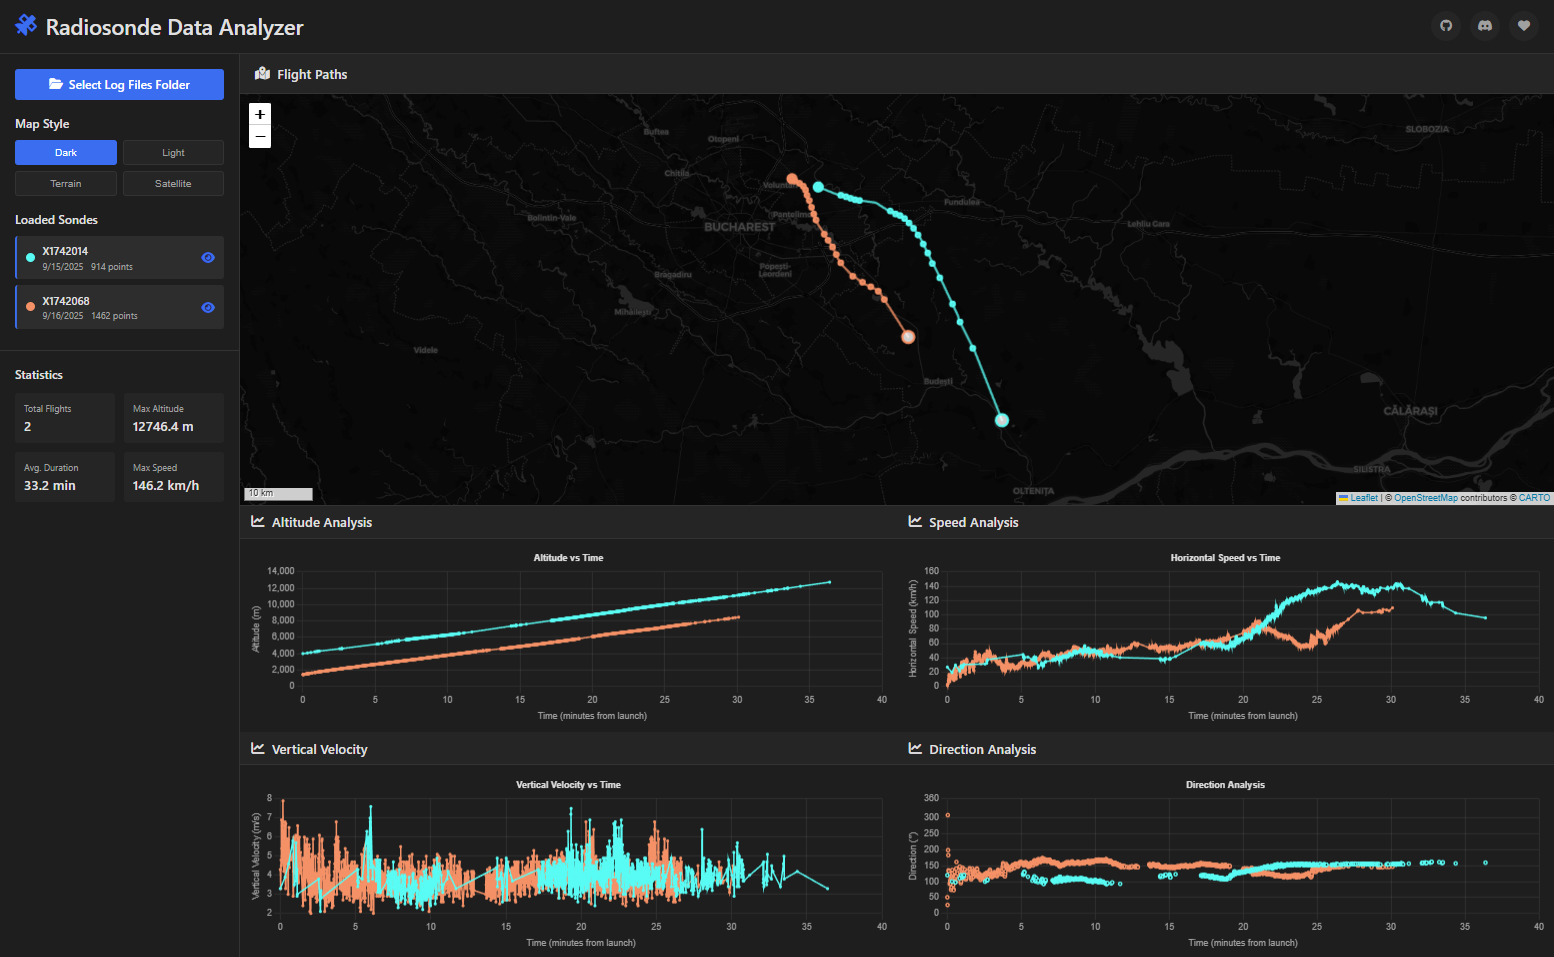
- Interactive Map Visualization: View flight paths with multiple base map styles (Dark, Light, Terrain, Satellite)
- Multi-Chart Analysis:
- Altitude vs Time
- Horizontal Speed vs Time
- Vertical Velocity vs Time
- Direction Analysis
- Statistics Dashboard: Track total flights, max altitude, average duration, and max speed
- Individual Sonde Control: Toggle visibility of specific sondes for focused analysis
- Responsive Design: Works on desktop and mobile devices
- File Directory Loading: Load multiple log files at once from a folder
Access the web version hosted on GitHub Pages:
🌐 thatsinewave.github.io/Radiosonde-Data-Analyzer
This tool processes .log files generated by the 9A4AM Radiosonde decoder in the following format:
YYYY-MM-DD HH:MM:SS | Lat: XX.XXXXX, Lon: XX.XXXXX, Alt: XXXX.X m, vH: XX.X km/h, vV: X.X m/s, Dir: XXX.X
Simply visit the live demo link above - no installation required!
-
Clone or Download the Repository
git clone https://github.com/ThatSINEWAVE/Radiosonde-Data-Analyzer.git cd Radiosonde-Data-Analyzer -
Serve the Files with a Local Server
Due to browser security restrictions, you need to serve the files through a local web server rather than opening the HTML file directly.
Using Python:
# Python 3
python -m http.server 8000

# Python 2
python -m SimpleHTTPServer 8000
Using Node.js:
npx http-server
Using PHP:
php -S localhost:8000
-
Open Your Browser Navigate to
http://localhost:8000(or the port you specified) -
Load Your Data
- Click "Select Log Files Folder"
- Navigate to the folder containing your radiosonde
.logfiles - Select the folder (the app will load all
.logfiles in that directory)
- Load Data: Use the folder selection button to load your radiosonde log files
- Map Navigation:
- Pan by dragging the map
- Zoom using mouse wheel or +/- buttons
- Switch between different map styles using the buttons in the sidebar
- Data Analysis:
- Click on individual sondes in the sidebar to toggle their visibility
- Hover over points on the map to see detailed information
- Analyze trends across the four different charts
- Statistics: View overall statistics in the sidebar panel
To create log files compatible with this analyzer:
- Use the Radiosonde decoder
- Configure the software to output log files in the supported format (Should be by default)
- The analyzer will automatically process the timestamp, coordinates, altitude, speeds, and direction data
- Chrome/Chromium (recommended)
- Firefox
- Safari
- Edge
Note: Some older browsers may not support all features.
- Built with vanilla JavaScript (no frameworks)
- Uses Leaflet.js for map visualization
- Chart.js for data visualization
- Modern CSS with CSS Grid and Flexbox
- Responsive design that works on mobile and desktop
Contributions are welcome! Feel free to:
- Report bugs or issues
- Suggest new features
- Submit pull requests
- Improve documentation
- 9A4AM for the Radiosonde decoder and tracker software
- Leaflet.js for mapping functionality
- Chart.js for data visualization
- Font Awesome for icons
This project is licensed under the GNU General Public License - see the MIT License file for details.