


The Python architect: turn any Python script, Jupyter notebook or whole project folder into a clear architecture diagram (draw.io, SVG, HTML or Mermaid for your README), without running it.
Website: samtherocket.github.io/flowblueprint
FlowBlueprint reads your code and draws how it flows: what runs first, which functions are called, what goes in and out of each step (with data types), where loops and decisions are, which files, databases and storage are read or written, and where plots are made. Managers, product owners and new team members can understand a pipeline before reading a single line of code; developers get an architecture diagram that stays in step with the source.
Part of a family of standalone Python tools: FuncLoom (functionizer), RefacTrail (refactorizer) and FlowBlueprint (architect).
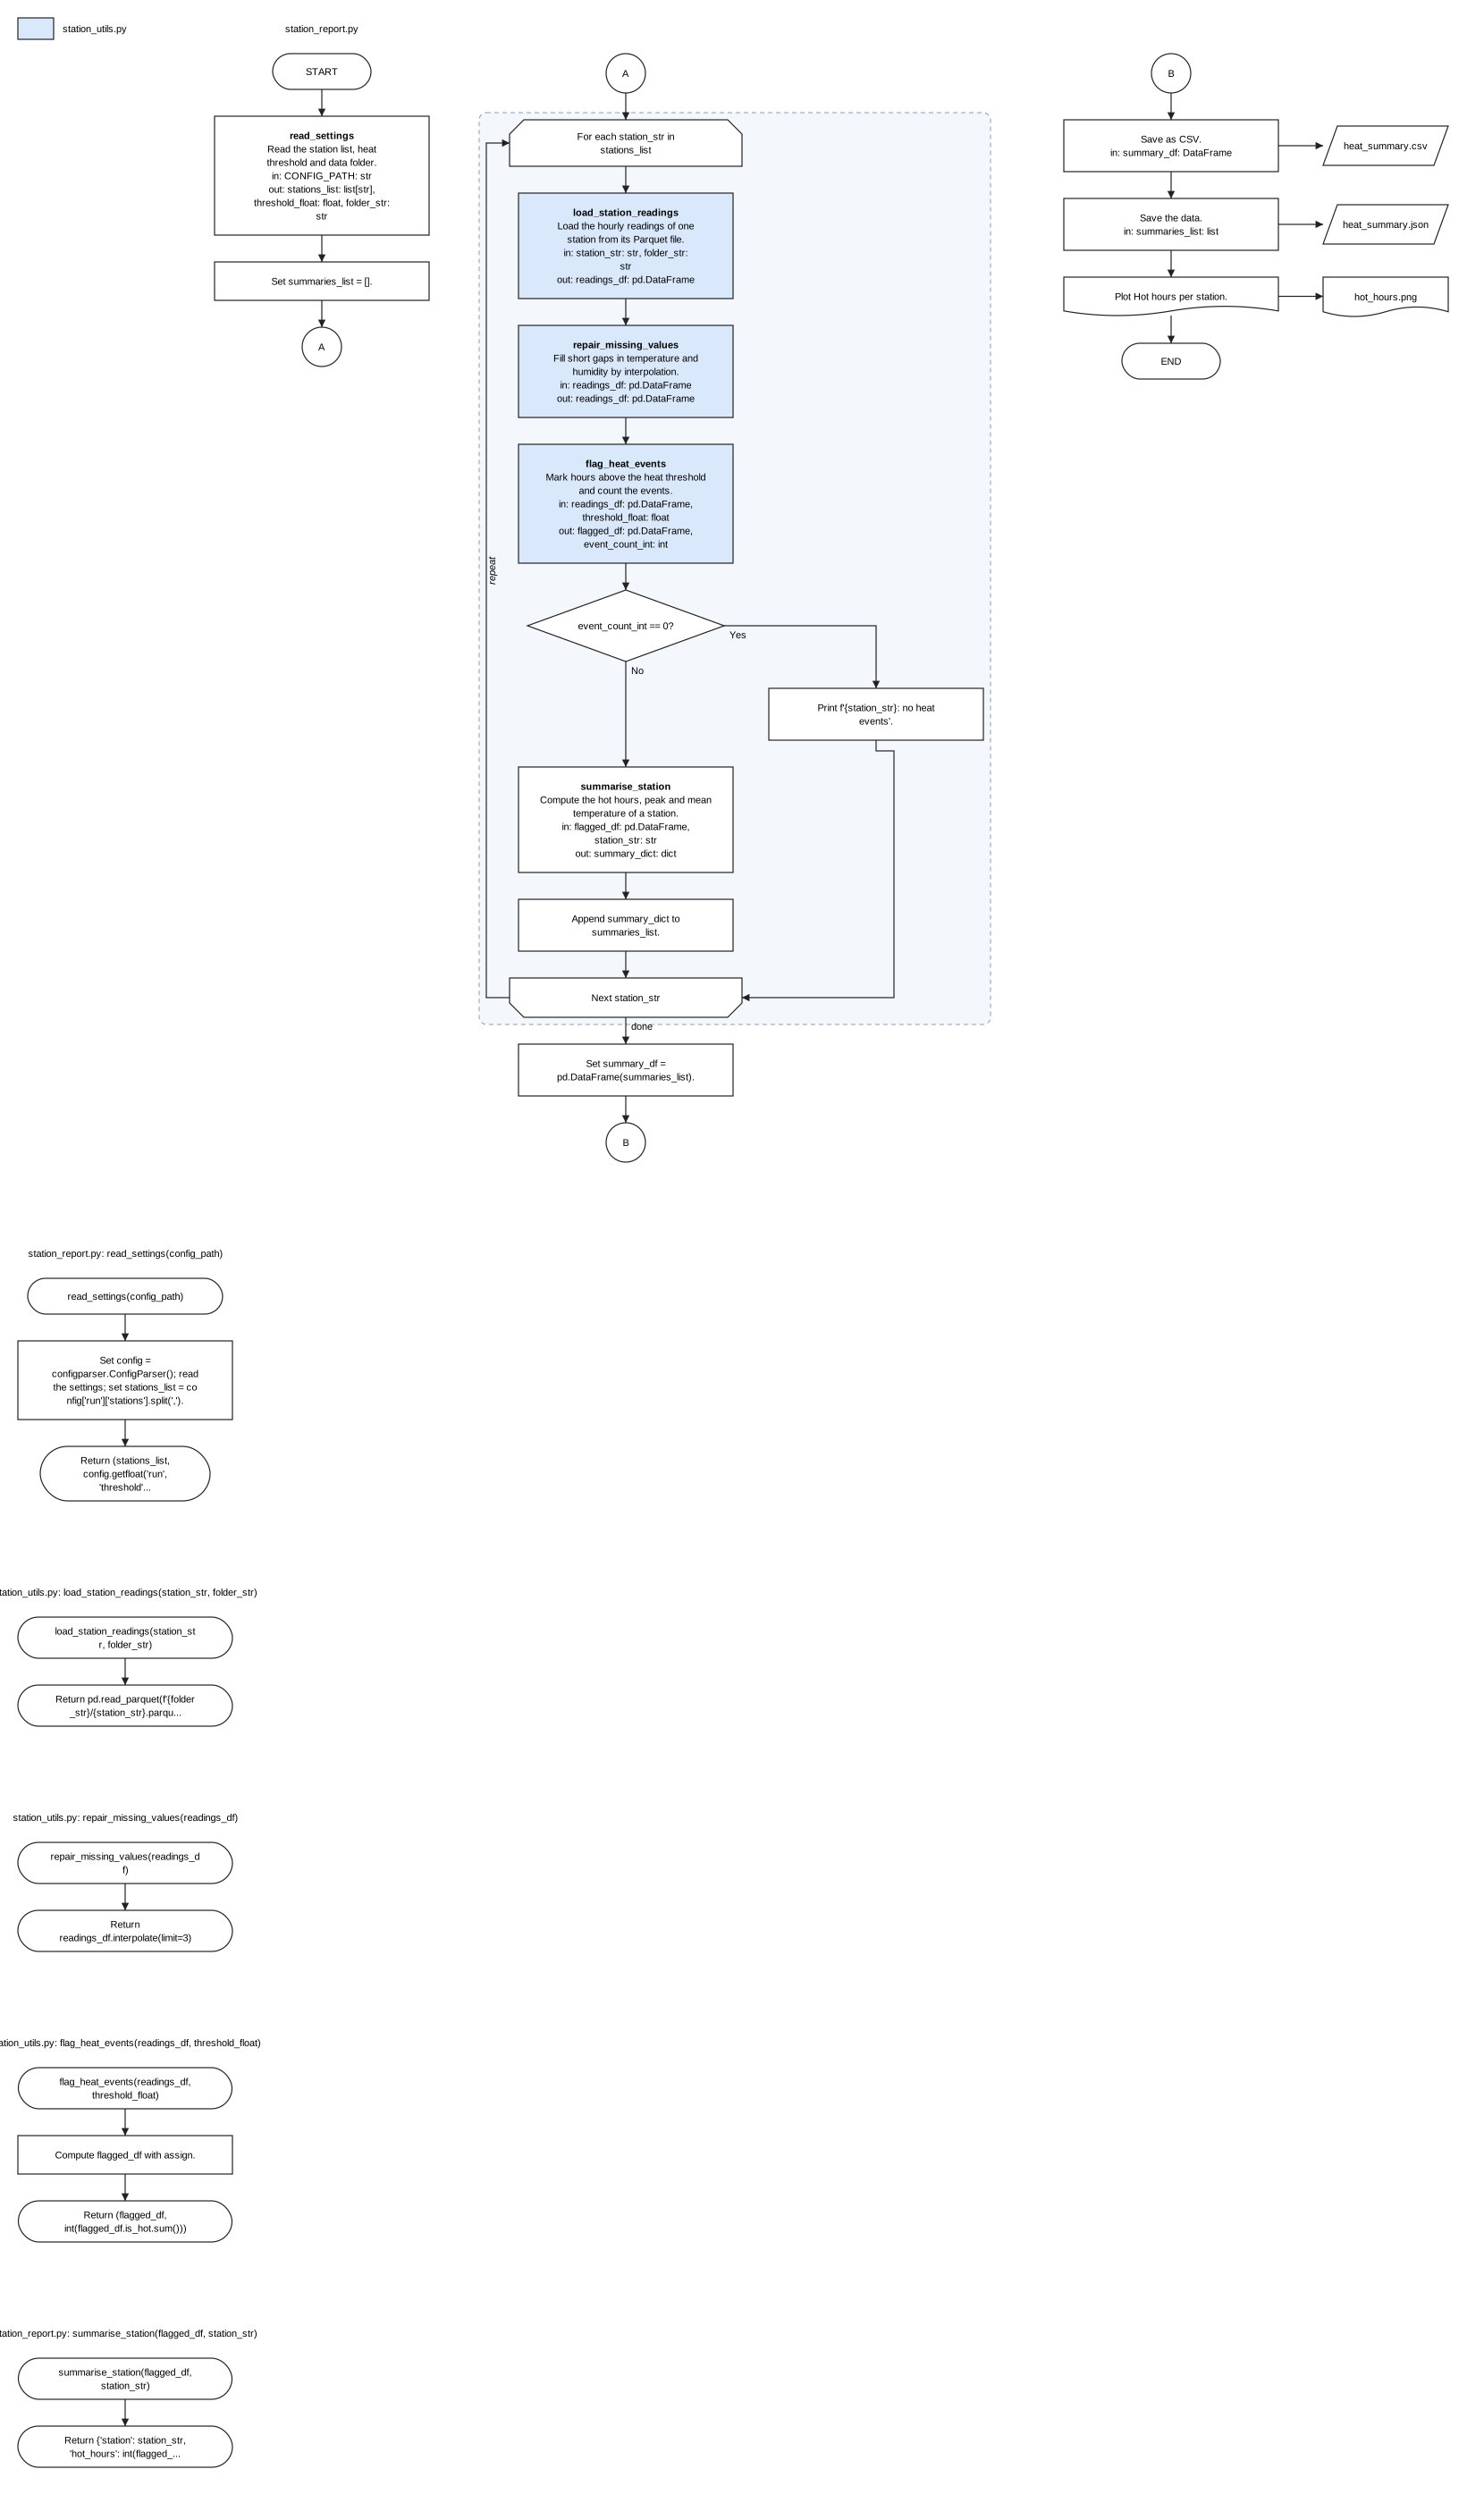
Status: alpha, version 0.2.1a0 on PyPI. Free and open source (MIT). Works offline: no AI model, account or internet connection needed.
-
Install (needs Python 3.12 or newer; older Python? see below):
pip install flowblueprint
-
Draw your script, notebook or whole project:
flowblueprint my_script.py                  # writes my_script.drawio
flowblueprint my_notebook.ipynb -o flow.svg # an image for slides
flowblueprint my_project/ -o ARCHITECTURE.md  # renders on GitHub
-
Open the result.
.drawioopens (and stays editable) in diagrams.net or VS Code's Draw.io Integration extension;.svgand.htmlopen in any browser;.mdshows the diagram on GitHub and GitLab. Your code is never run or changed.
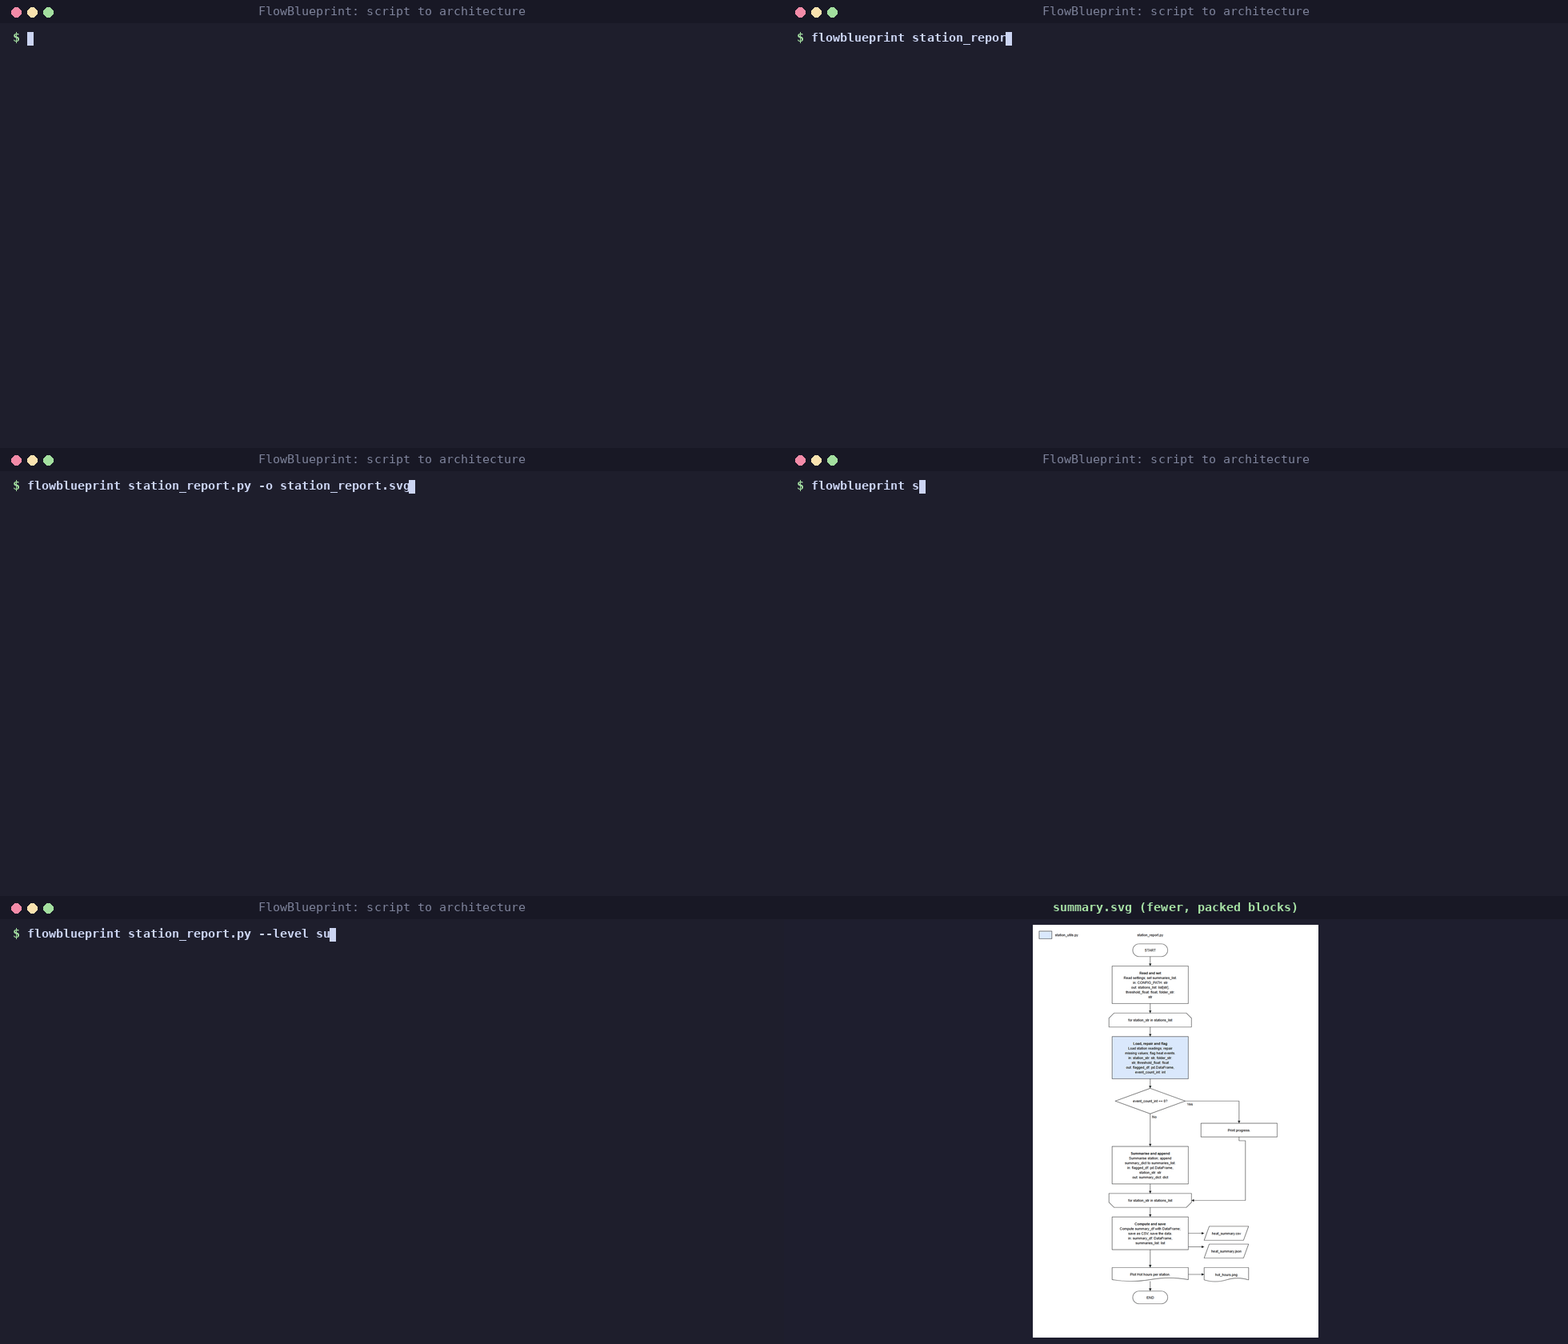
Too many blocks? Add --level summary for a higher-level picture.
pip install flowblueprint also installs FuncLoom and RefacTrail.
- Install FlowBlueprint from the Extensions view (search FlowBlueprint).
- Right-click a
.pyfile, a notebook or a folder in the Explorer and choose Draw architecture of this file (or of this project). The Command Palette (Ctrl+Shift+P, type FlowBlueprint) works too. - Pick a format (
.drawio,.svg,.htmlor.md). The diagram is saved next to your file (architecture.<format>for a folder) and opens straight away. The first time, click Install when asked.
- New VS Code extension on the Marketplace: right-click to draw a file or a whole project.
- Older-Python projects: a step-by-step guide, tested with code for Python 3.8, 3.9 and 3.10.
- A simpler README. Drawing is unchanged; 0.2.0a0's project overviews, Mermaid and HTML output are in the changelog.
No problem. FlowBlueprint only reads your code, so it runs on its own Python 3.12 or newer while your project stays on Python 3.8, 3.9, 3.10 or 3.11. Do this once:
-
Make a separate Python for the tools (no admin rights needed):
# Windows (Command Prompt)
py -3.12 -m venv %USERPROFILE%\py-tools
%USERPROFILE%\py-tools\Scripts\python -m pip install flowblueprint

# macOS / Linux
python3.12 -m venv ~/py-tools
~/py-tools/bin/python -m pip install flowblueprint
No Python 3.12 on the machine? Run
pip install uv, thenuvx --python 3.12 flowblueprint my_script.py: uv downloads Python 3.12 for you. -
Run FlowBlueprint with that Python:
%USERPROFILE%\py-tools\Scripts\python -m flowblueprint my_script.py     # Windows
~/py-tools/bin/python -m flowblueprint my_script.py                       # macOS / Linux
-
In VS Code, open Settings, search for
flowblueprint.pythonPathand paste the path of that Python (for exampleC:\Users\YOU\py-tools\Scripts\python.exe).
Your project keeps using its own Python to run. More detail, limits and fixes for common errors: the older-Python guide.
If pip install flowblueprint says from versions: none, your Python is older
than 3.12 (use the steps above) or your company's package mirror does not
carry it yet (ask IT to allow it).
The suffix of -o picks the format:
| Suffix | You get | Good for |
|---|---|---|
.drawio (default) |
An editable diagram | diagrams.net, the VS Code Draw.io extension |
.svg |
An image | Slides, documents, READMEs |
.png |
A picture at twice the size, on white | Chat, e-mail, Word and PowerPoint (needs pip install "flowblueprint[png]") |
.html |
A self-contained web page with the image and notes | E-mail, tickets, sharing without tools |
.md |
Markdown with a Mermaid flowchart | GitHub and GitLab READMEs, wikis, Obsidian |
.mmd |
Mermaid text | Notion, documentation sites, Mermaid tools |
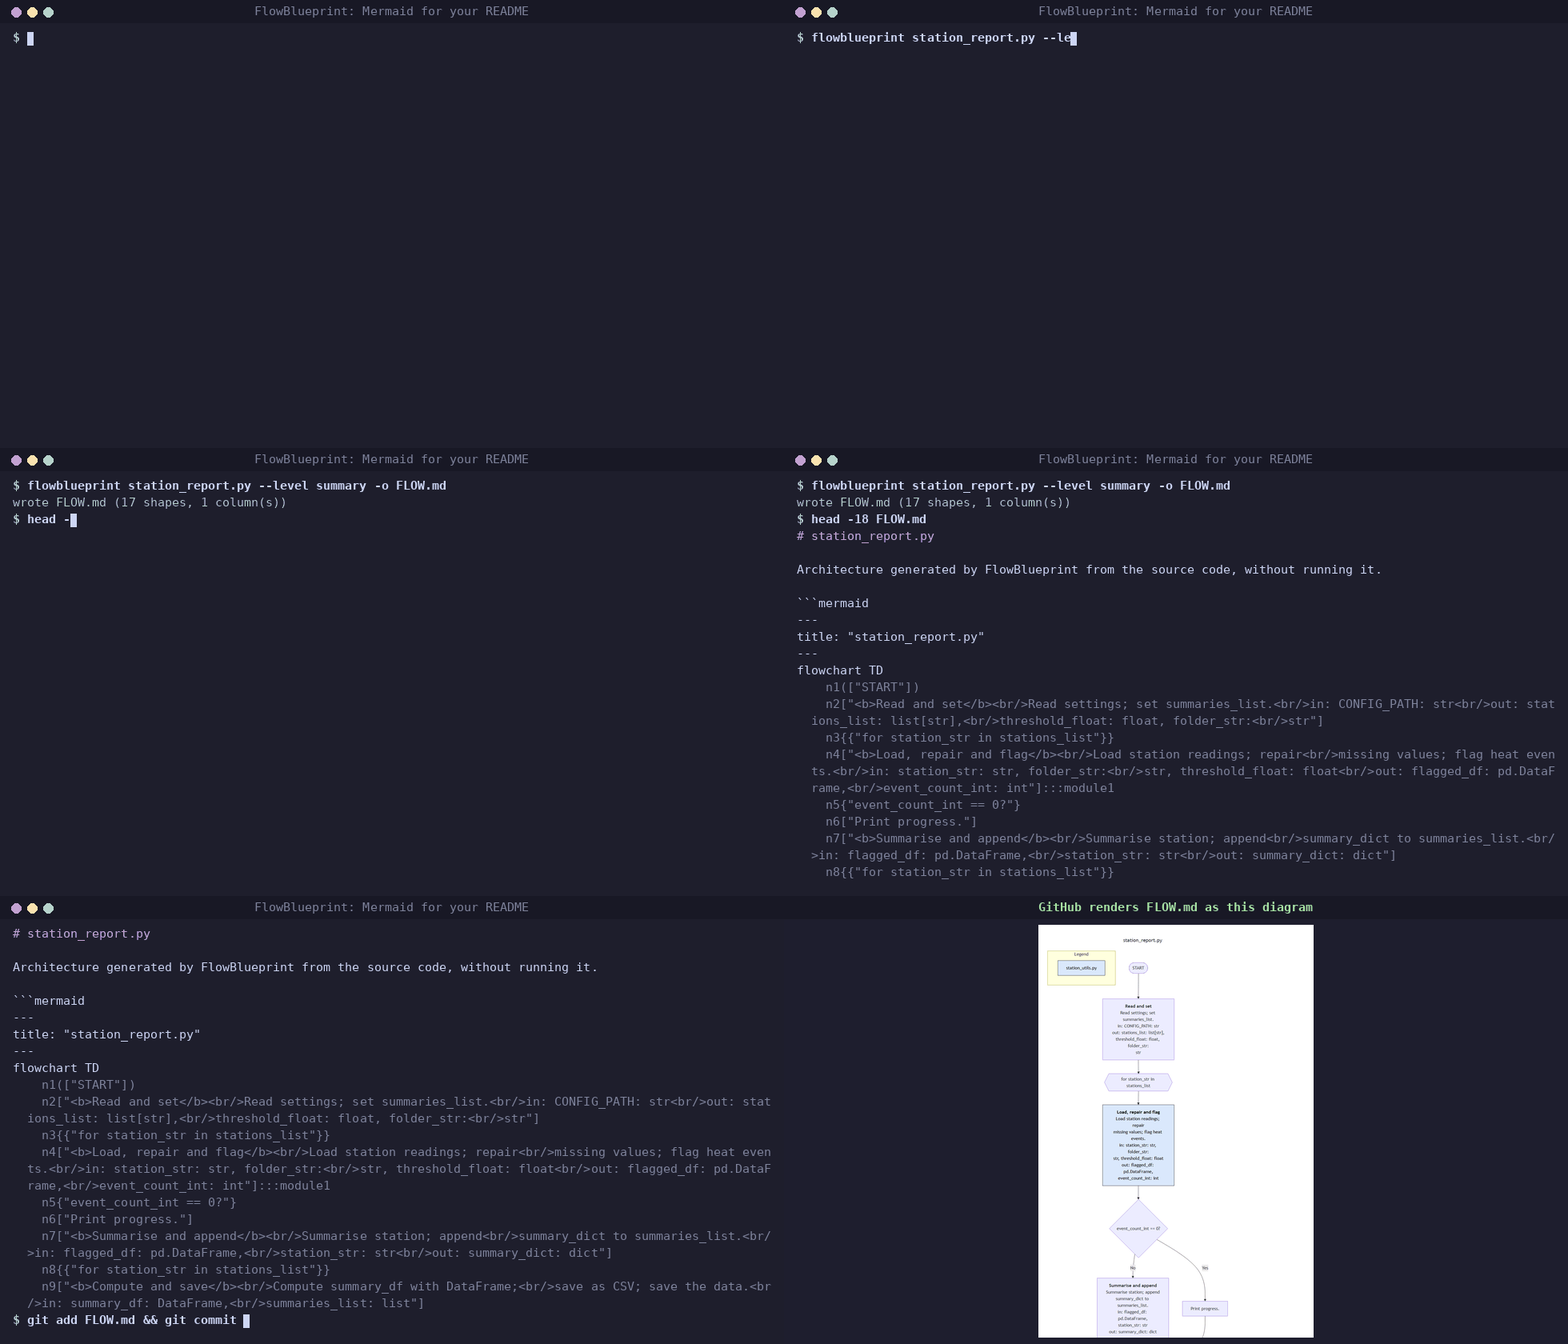
A Mermaid diagram lives in your repository as text and GitHub draws it.
This one is flowblueprint station_report.py --level summary -o FLOW.md:
---
title: "station_report.py"
---
flowchart TD
    n1(["START"])
    n2["<b>Read and set</b><br/>Read settings; set summaries_list.<br/>in: CONFIG_PATH: str<br/>out: stations_list: list[str],<br/>threshold_float: float, folder_str:<br/>str"]
    n3{{"for station_str in stations_list"}}
    n4["<b>Load, repair and flag</b><br/>Load station readings; repair<br/>missing values; flag heat events.<br/>in: station_str: str, folder_str:<br/>str, threshold_float: float<br/>out: flagged_df: pd.DataFrame,<br/>event_count_int: int"]:::module1
    n5{"event_count_int == 0?"}
    n6["Print progress."]
    n7["<b>Summarise and append</b><br/>Summarise station; append<br/>summary_dict to summaries_list.<br/>in: flagged_df: pd.DataFrame,<br/>station_str: str<br/>out: summary_dict: dict"]
    n8{{"for station_str in stations_list"}}
    n9["<b>Compute and save</b><br/>Compute summary_df with DataFrame;<br/>save as CSV; save the data.<br/>in: summary_df: DataFrame,<br/>summaries_list: list"]
    n10[/"heat_summary.csv"/]
    n11[/"heat_summary.json"/]
    n12>"Plot Hot hours per station."]
    n13>"hot_hours.png"]
    n14(["END"])
    n1 --> n2
    n2 --> n3
    n3 --> n4
    n5 -->|"Yes"| n6
    n4 --> n5
    n5 -->|"No"| n7
    n7 --> n8
    n9 -.-> n10
    n9 -.-> n11
    n8 --> n9
    n12 -.-> n13
    n9 --> n12
    n12 --> n14
    n6 --> n8
    subgraph legend["Legend"]
        legend1["station_utils.py"]:::module1
    end
    classDef module1 fill:#dae8fc,stroke:#222222,color:#000000
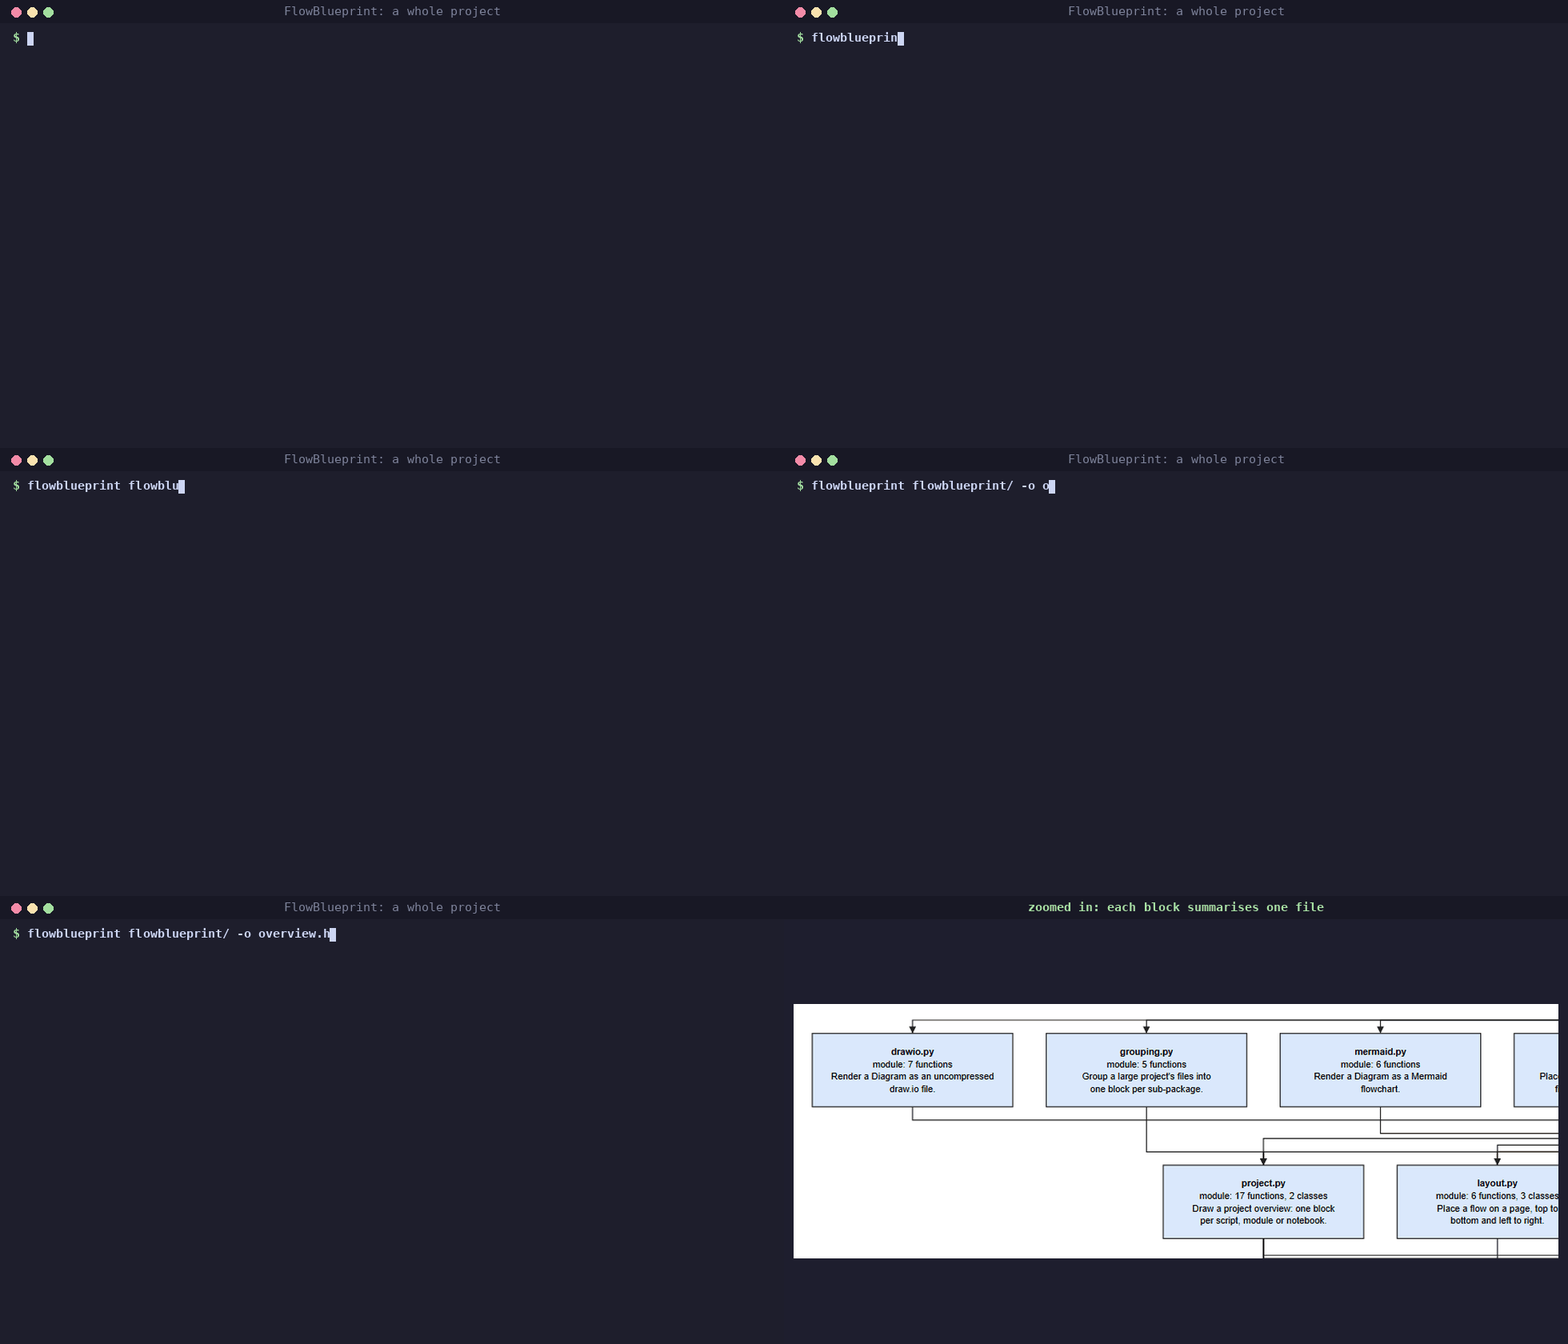
Point FlowBlueprint at a folder to see the whole project: one block per script, module, package and notebook, with an arrow from each file to the project files it imports. Entry points sit at the top and the modules they rely on below them. Each block says what the file is (its docstring, the steps it runs, or the functions it provides), how many functions and classes it defines, and which files, databases and storage it reads and writes.
flowblueprint my_project/                        # my_project/architecture.drawio
flowblueprint my_project/ -o ARCHITECTURE.md     # Mermaid for the README
flowblueprint my_project/ --include-tests -o overview.html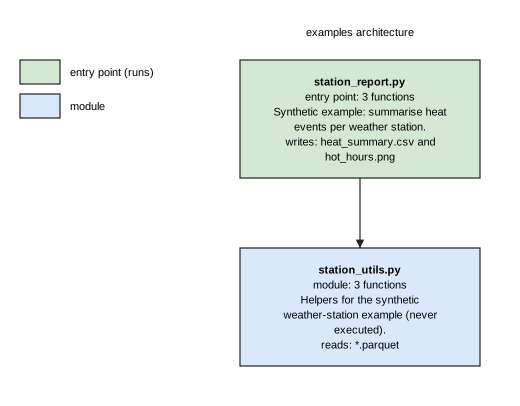
Large projects stay readable: above 40 files, files are grouped into one
block per sub-package (the deepest folder level that fits 40 blocks),
each summing its files, functions, classes and data and naming the
scripts it runs. --group-depth 2 picks the level yourself;
--group-depth 0 draws every file.
Absolute, relative and sibling-script imports are resolved, including
src layouts and folders inside packages. Virtual environments,
caches, build output and hidden folders are skipped; test files are
skipped unless you pass --include-tests. Files that cannot be parsed
are listed as notes instead of stopping the run. In the draw.io, SVG,
PNG and HTML output every arrow has its own start and end point on its
blocks and its own line between rows, so arrows between different blocks
never overlap or pass behind a block; an arrow that skips rows drops
through the nearest free gap between blocks. Only a very busy block (more
arrows than fit side by side on its edge) gathers neighbouring arrows of
one direction into a shared line, like a bus. The Mermaid output is laid
out by Mermaid itself.
| In your code | In the diagram |
|---|---|
| The script or notebook name | A title above the flow |
| Start and end of the run | START and END terminators |
| A call to your own function or method | A block: name, one-line description, in: and out: with data types |
| Several small operations | One plain block, or one packed block at --level summary |
| Functions from your own modules | Coloured blocks, with a colour legend per module |
for / while loops |
Opening and closing loop-limit shapes |
Notebook Markdown headings, # %% Title cell markers |
Dashed section banners that split the flow |
if / elif / else |
A decision diamond with Yes and No paths |
continue, break, return in a branch |
An arrow to the loop end, past the loop, or to END |
| CSV, Parquet, Excel, JSON, config files | Data shapes on the left (read) or right (written) |
| SQL reads and writes | Database cylinders |
s3://, gs://, network shares |
Storage shapes |
| matplotlib, seaborn, plotly | A plot block, with saved figures as documents |
| Long flows | Columns of at most 10 blocks joined by A/B connectors |
Descriptions come from docstrings. Without one, FlowBlueprint writes a
short, deterministic description from the code itself: the function
name read as a verb phrase plus what its body visibly does ("Load
sales: opens path; reads CSV rows; returns rows."). Short statements
are shown as written (Set big = {}, Print 'skipping', fname).
Types come from annotations, well-known library calls, literals (also
a returned list or dict built in the function) and naming conventions
such as _df or _list; anything else is shown as unknown rather
than guessed.
Loops are framed: a light dashed box holds everything that repeats,
from For each row in rows down to Next row, with a repeat
arrow back to the top. try/except handlers appear as
"KeyError raised?" decisions.
By default (--level full) one drawing holds several pages, which
draw.io shows as tabs and SVG, PNG, HTML and Markdown show one after
another:
- Overview: the main flow with consecutive operations packed into
higher-level blocks (up to
--group-size, default 4). Left out when the main flow is already short. - Main flow: one block per call, from START to END.
- One page per function you wrote that the flow calls (and the functions they call, up to 40), from the function's signature to what it returns, with its own loops and decisions.
--level detailed draws pages 2 and 3; --level summary only the
overview. A project folder gets its import overview first, then the
pages of each entry-point script and notebook.
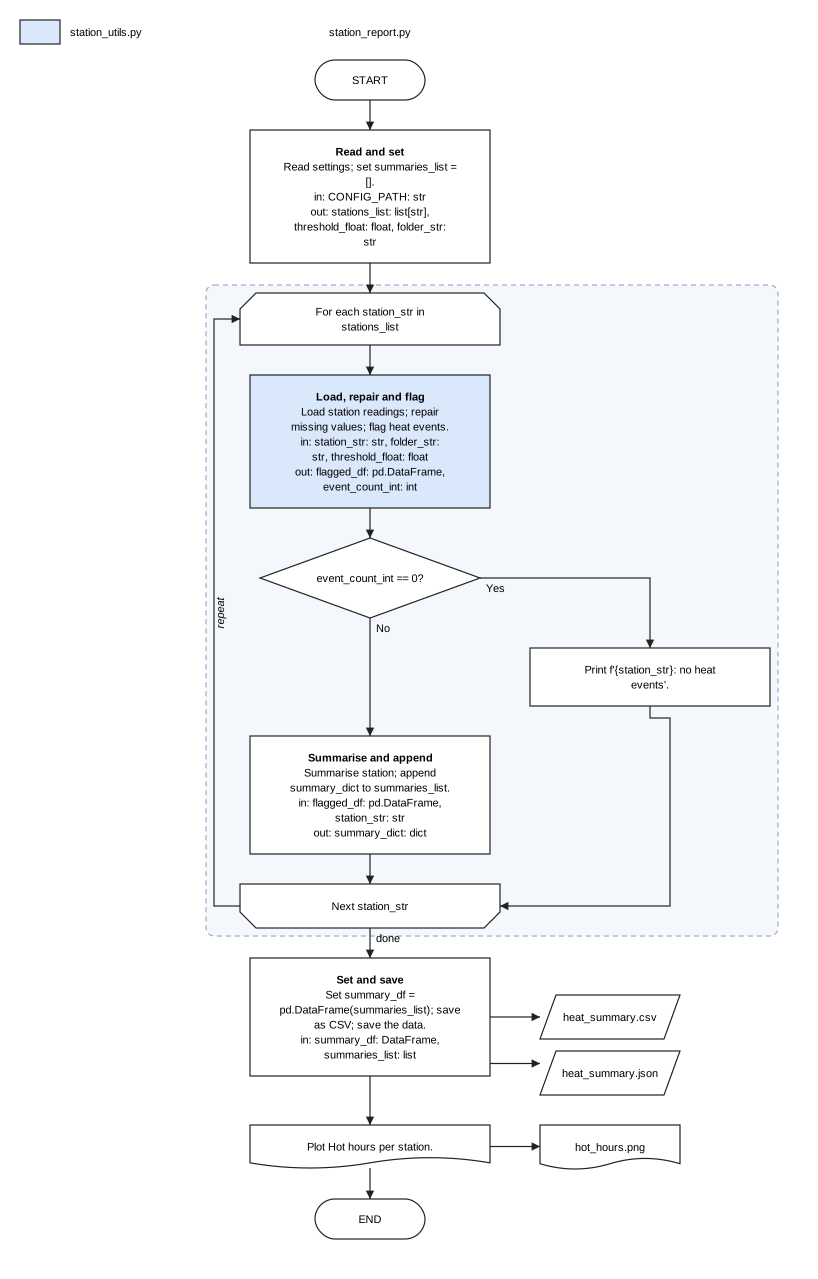
A summary block lists its operations with the inputs it needs and the outputs it leaves:
You choose the grouping when it matters, with an override file:
# blueprint.toml
[[groups]]
title = "prepare_readings"
description = "Load and clean the readings of one station."
functions = ["load_station_readings", "repair_missing_values"]

[blocks.flag_heat_events]
description = "Find the hours above the heat threshold."
flowblueprint station_report.py --overrides blueprint.tomlFlowBlueprint works directly on any readable script; you do not need to
run FuncLoom or RefacTrail first. Classes are understood: Pipeline(...)
becomes a Create the Pipeline block, pipeline.load() resolves to the
method and its docstring, and when the entry point only hands over to one
method (Pipeline(config).run()), that method's steps are drawn.
FlowBlueprint's own ARCHITECTURE.md is drawn this way
(flowblueprint src/flowblueprint -o ARCHITECTURE.md).
In GitHub Actions, the FlowBlueprint action draws the diagram on every push; commit it, or keep it as a build artifact:
- uses: actions/checkout@v4
- uses: SAMtheROCKET/flowblueprint@main
  with:
    path: .                     # a script, notebook or folder
    output: ARCHITECTURE.md     # .md, .mmd, .drawio, .svg or .html
    args: --level summary       # optional extra options
- uses: actions/upload-artifact@v4
  with:
    name: architecture
    path: ARCHITECTURE.md
To fail a pull request when someone changed the code but not the
committed diagram, add check: "true". Nothing is drawn; the step fails
when ARCHITECTURE.md is missing or out of date, and passes otherwise:
- uses: SAMtheROCKET/flowblueprint@main
  with:
    output: ARCHITECTURE.md
    check: "true"
The same check on the command line is
flowblueprint . -o ARCHITECTURE.md --up-to-date (exit code 1 when
stale; line endings are ignored).
With pre-commit, the
flowblueprint-architecture hook redraws ARCHITECTURE.md whenever
Python files or notebooks change (or use
flowblueprint-architecture-check to fail instead of redrawing):
repos:
  - repo: https://github.com/SAMtheROCKET/flowblueprint
    rev: main
    hooks:
- id: flowblueprint-architectureEvery diagram is checked against block-diagram rules: start and end
terminators, the script name, closed loops, no open-ended blocks, data
sources on the left, the per-column limit, a legend for every colour, and
verb-first titles. --check only checks and exits with 1 on errors.
Statements that are not drawn (for example exception handlers) are
reported with their line numbers.
- Developers and data scientists: document a pipeline, review a pull request, or explain a notebook to the team.
- Managers, product owners and project managers: see what a script does, step by step, before a review or planning meeting.
- Students and teachers: present coursework and assignments as a clear flowchart.
- Teams taking over code: get an architecture overview of unfamiliar scripts in seconds.
The code is parsed with Python's own ast module and is never imported or
executed. The source file is never changed. Existing output files are not
overwritten unless you pass --force.
Robustness: every file of the Python 3.12 standard library (584 files) and of a 6,988-file corpus of installed packages (NumPy, SciPy, SymPy, matplotlib, Twisted and others) is drawn in detailed and summary form and rendered as draw.io, SVG and Mermaid without an error, as are project overviews of all 92 packages in that corpus (SymPy's 801 files and 6,404 imports take under 5 seconds).
FlowBlueprint installs FuncLoom and RefacTrail and uses them through absolute imports (for example RefacTrail's validated notebook reader). Use them together for one flow: FuncLoom turns long scripts and notebooks into functions and modules, RefacTrail checks, formats and refactors them, and FlowBlueprint draws the architecture.
Looking for a Python architecture diagram generator, code to flowchart, script to architecture, notebook to architecture, project architecture diagram, Python to Mermaid, workflow diagram generator or auto architecture generator (archgen)? That is what FlowBlueprint does.
- 0.3: cleaner arrow routing in large project overviews and more library knowledge for data types.
- Later, optional: AI-written descriptions, always shown with their source evidence and never required.
MIT. See LICENSE.