Hoeffding’s test for dependence was proposed by Wassily Hoeffding (1948) as a test of correlation for two variables with continuous distribution functions. Hoeffding’s D is a nonparametric measure of the distance between the joint distribution F(x, y) and the product of marginal distributions F1(x)F2(y). The advantage of this statistic lies in the fact that it has more power to detect non-monotonic dependency structures compared to other more common measures (Pearson, Kendall, Spearman)
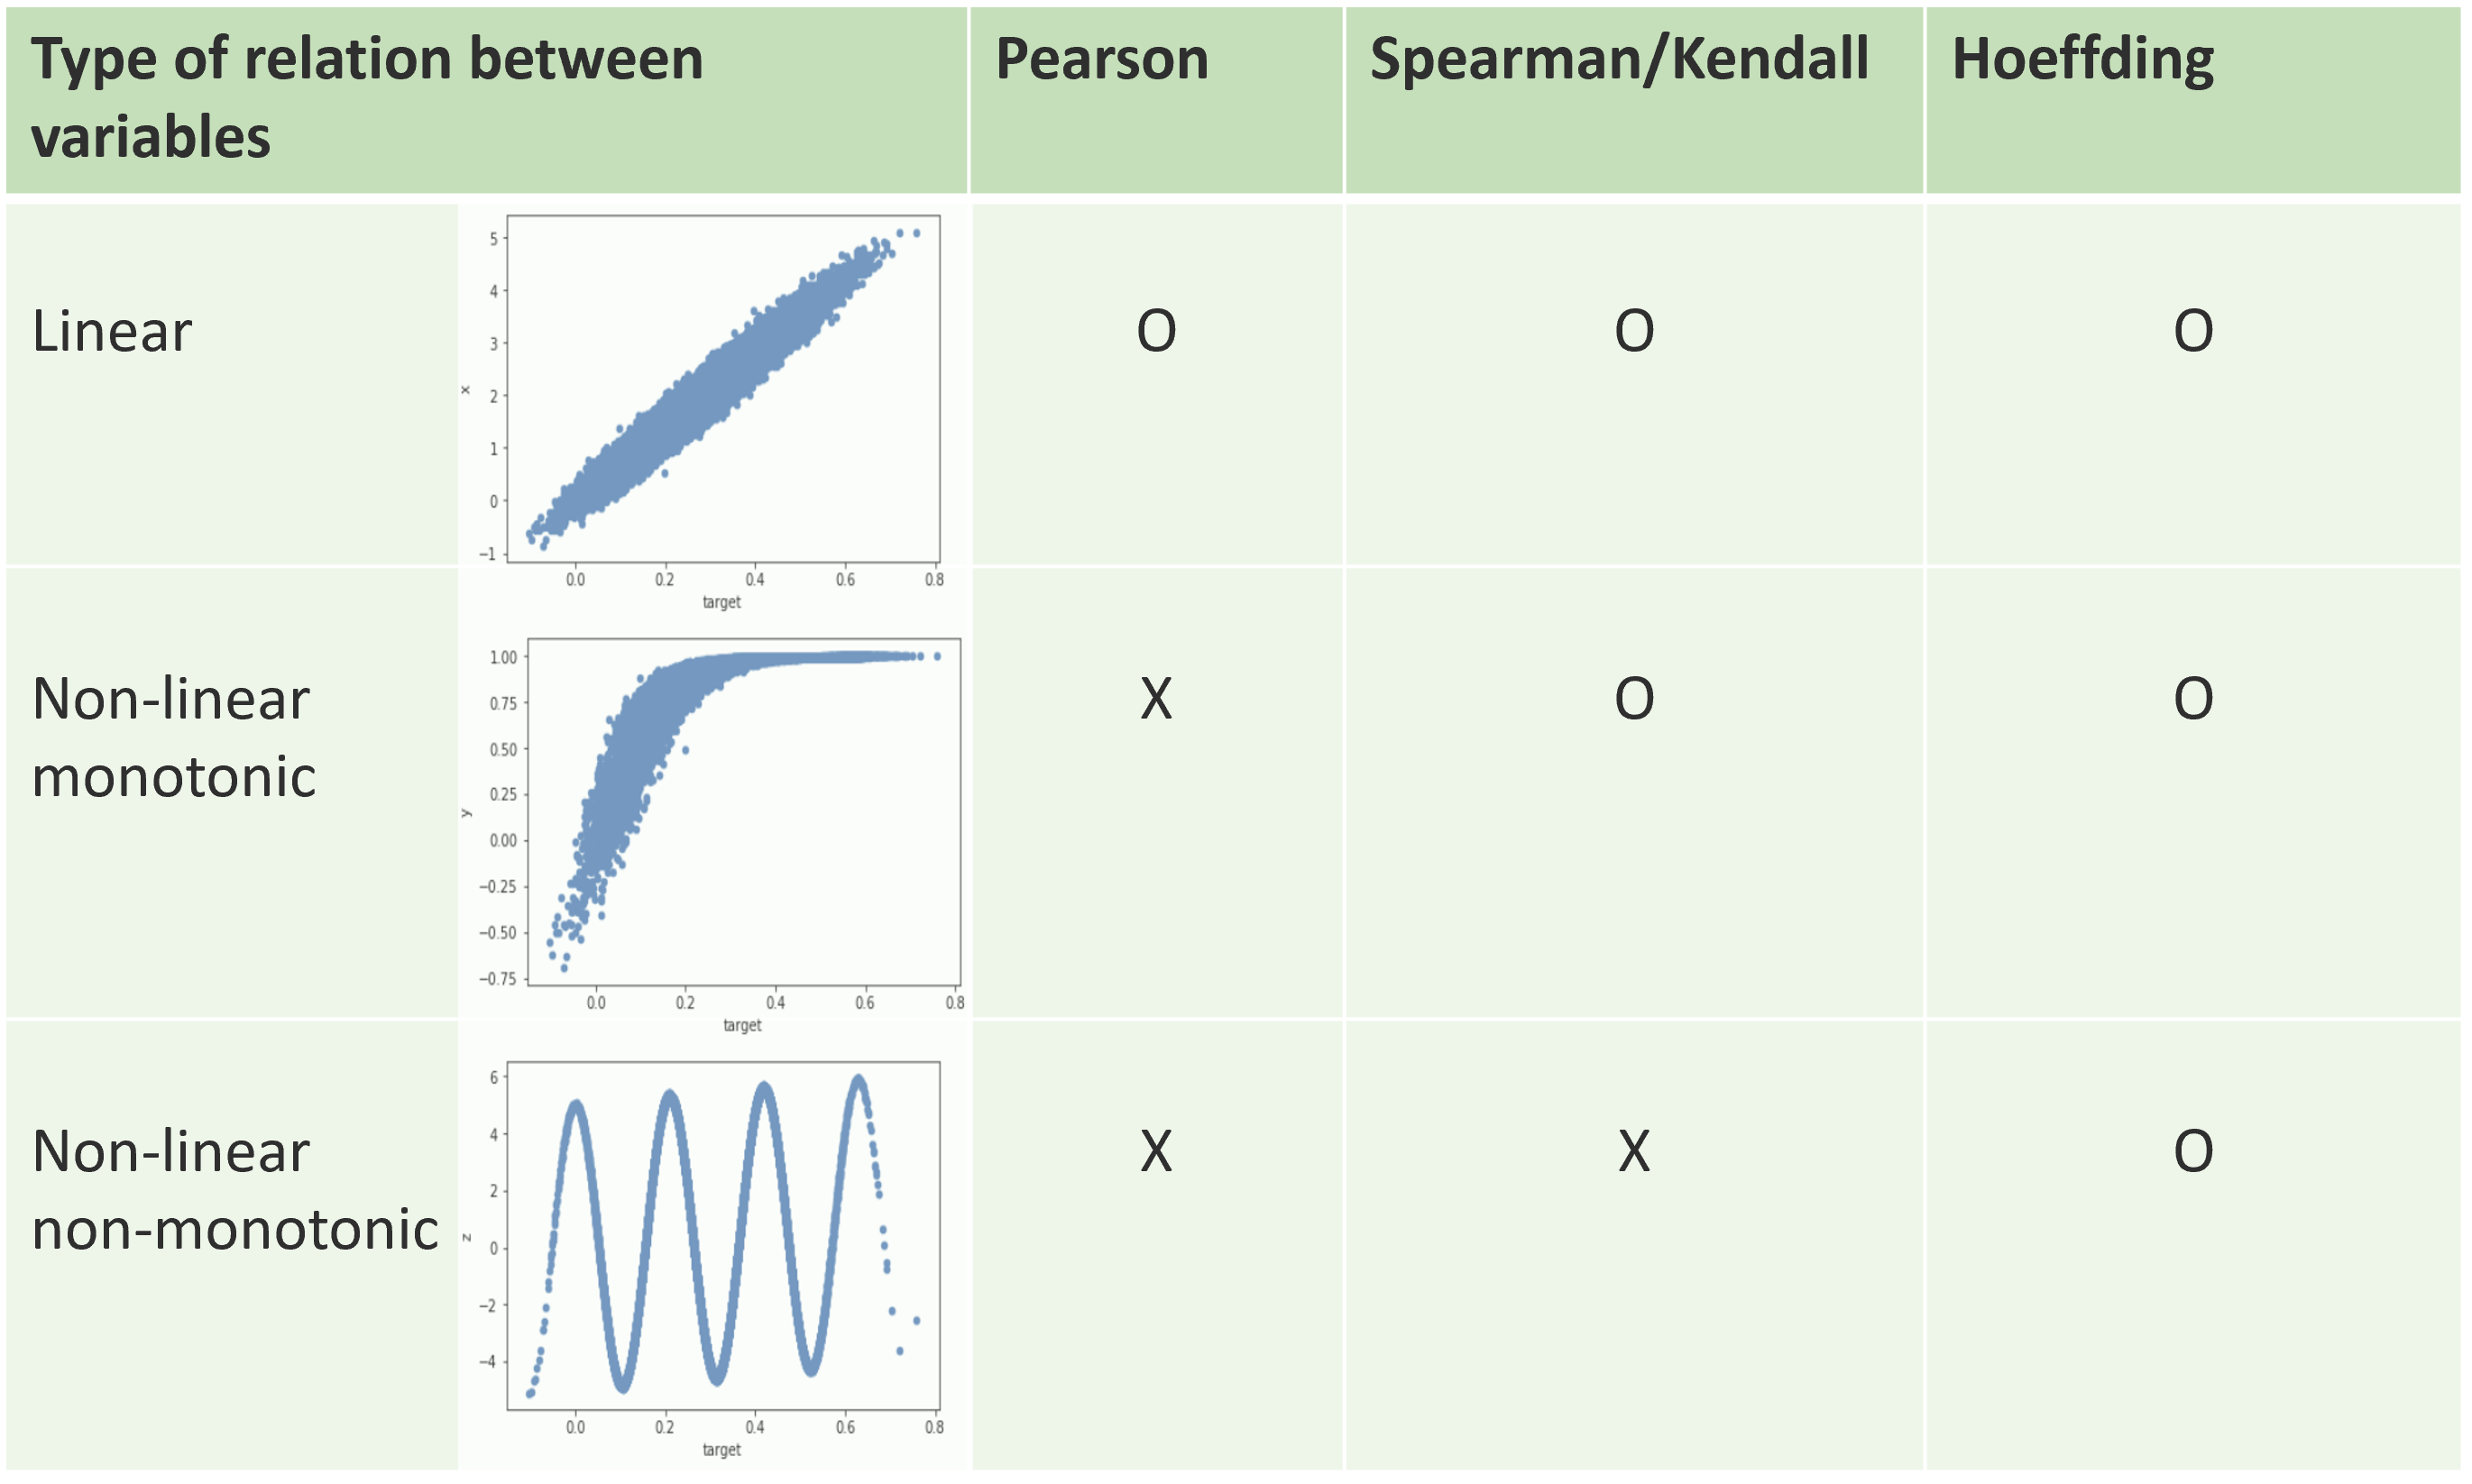
The following graph presents what we can expect to discover by using more advanced correlation coefficients.
A proper implementation in python is not existing so far. The original algorithm presents more complexity (O(n2)) than other popular correlation coefficients like Pearson or Spearman and was basically done for the statistics in the second part of the 20th century (which means a size order of ~100 points). Nowadays, the "big data period", it's common to search relations between time-series with millions of points. On could say that it is not often relevant (if there's no stationarity), but the move for automated analytical tools plays in favor of such develoment. The remark is anyway valid for other correlation coefficients. This coefficient is available in some premium analytics sofware (SAS, JMP; in an efficient implementation), in R (which is originally more dedicated to statistics), in Matlab (for small data), but unavailable in Python. So we propose here an efficient implementation in python3, which is callable as a method by the corr() function for dataframe in Pandas.
The development steps were the followings:
- Starting algorithm in Matlab
- Rough adaptation in python
- Code optimisation - complexity O(n²) (33x faster on 1000 points -> 2,40ms)
- Constrained algorithm-> binning on entries (50) and resampling if n >100000 – acceptable approximation
- Support dataFrame as input
- Compatible with correlation function correlation in Pandas (from v0.24)
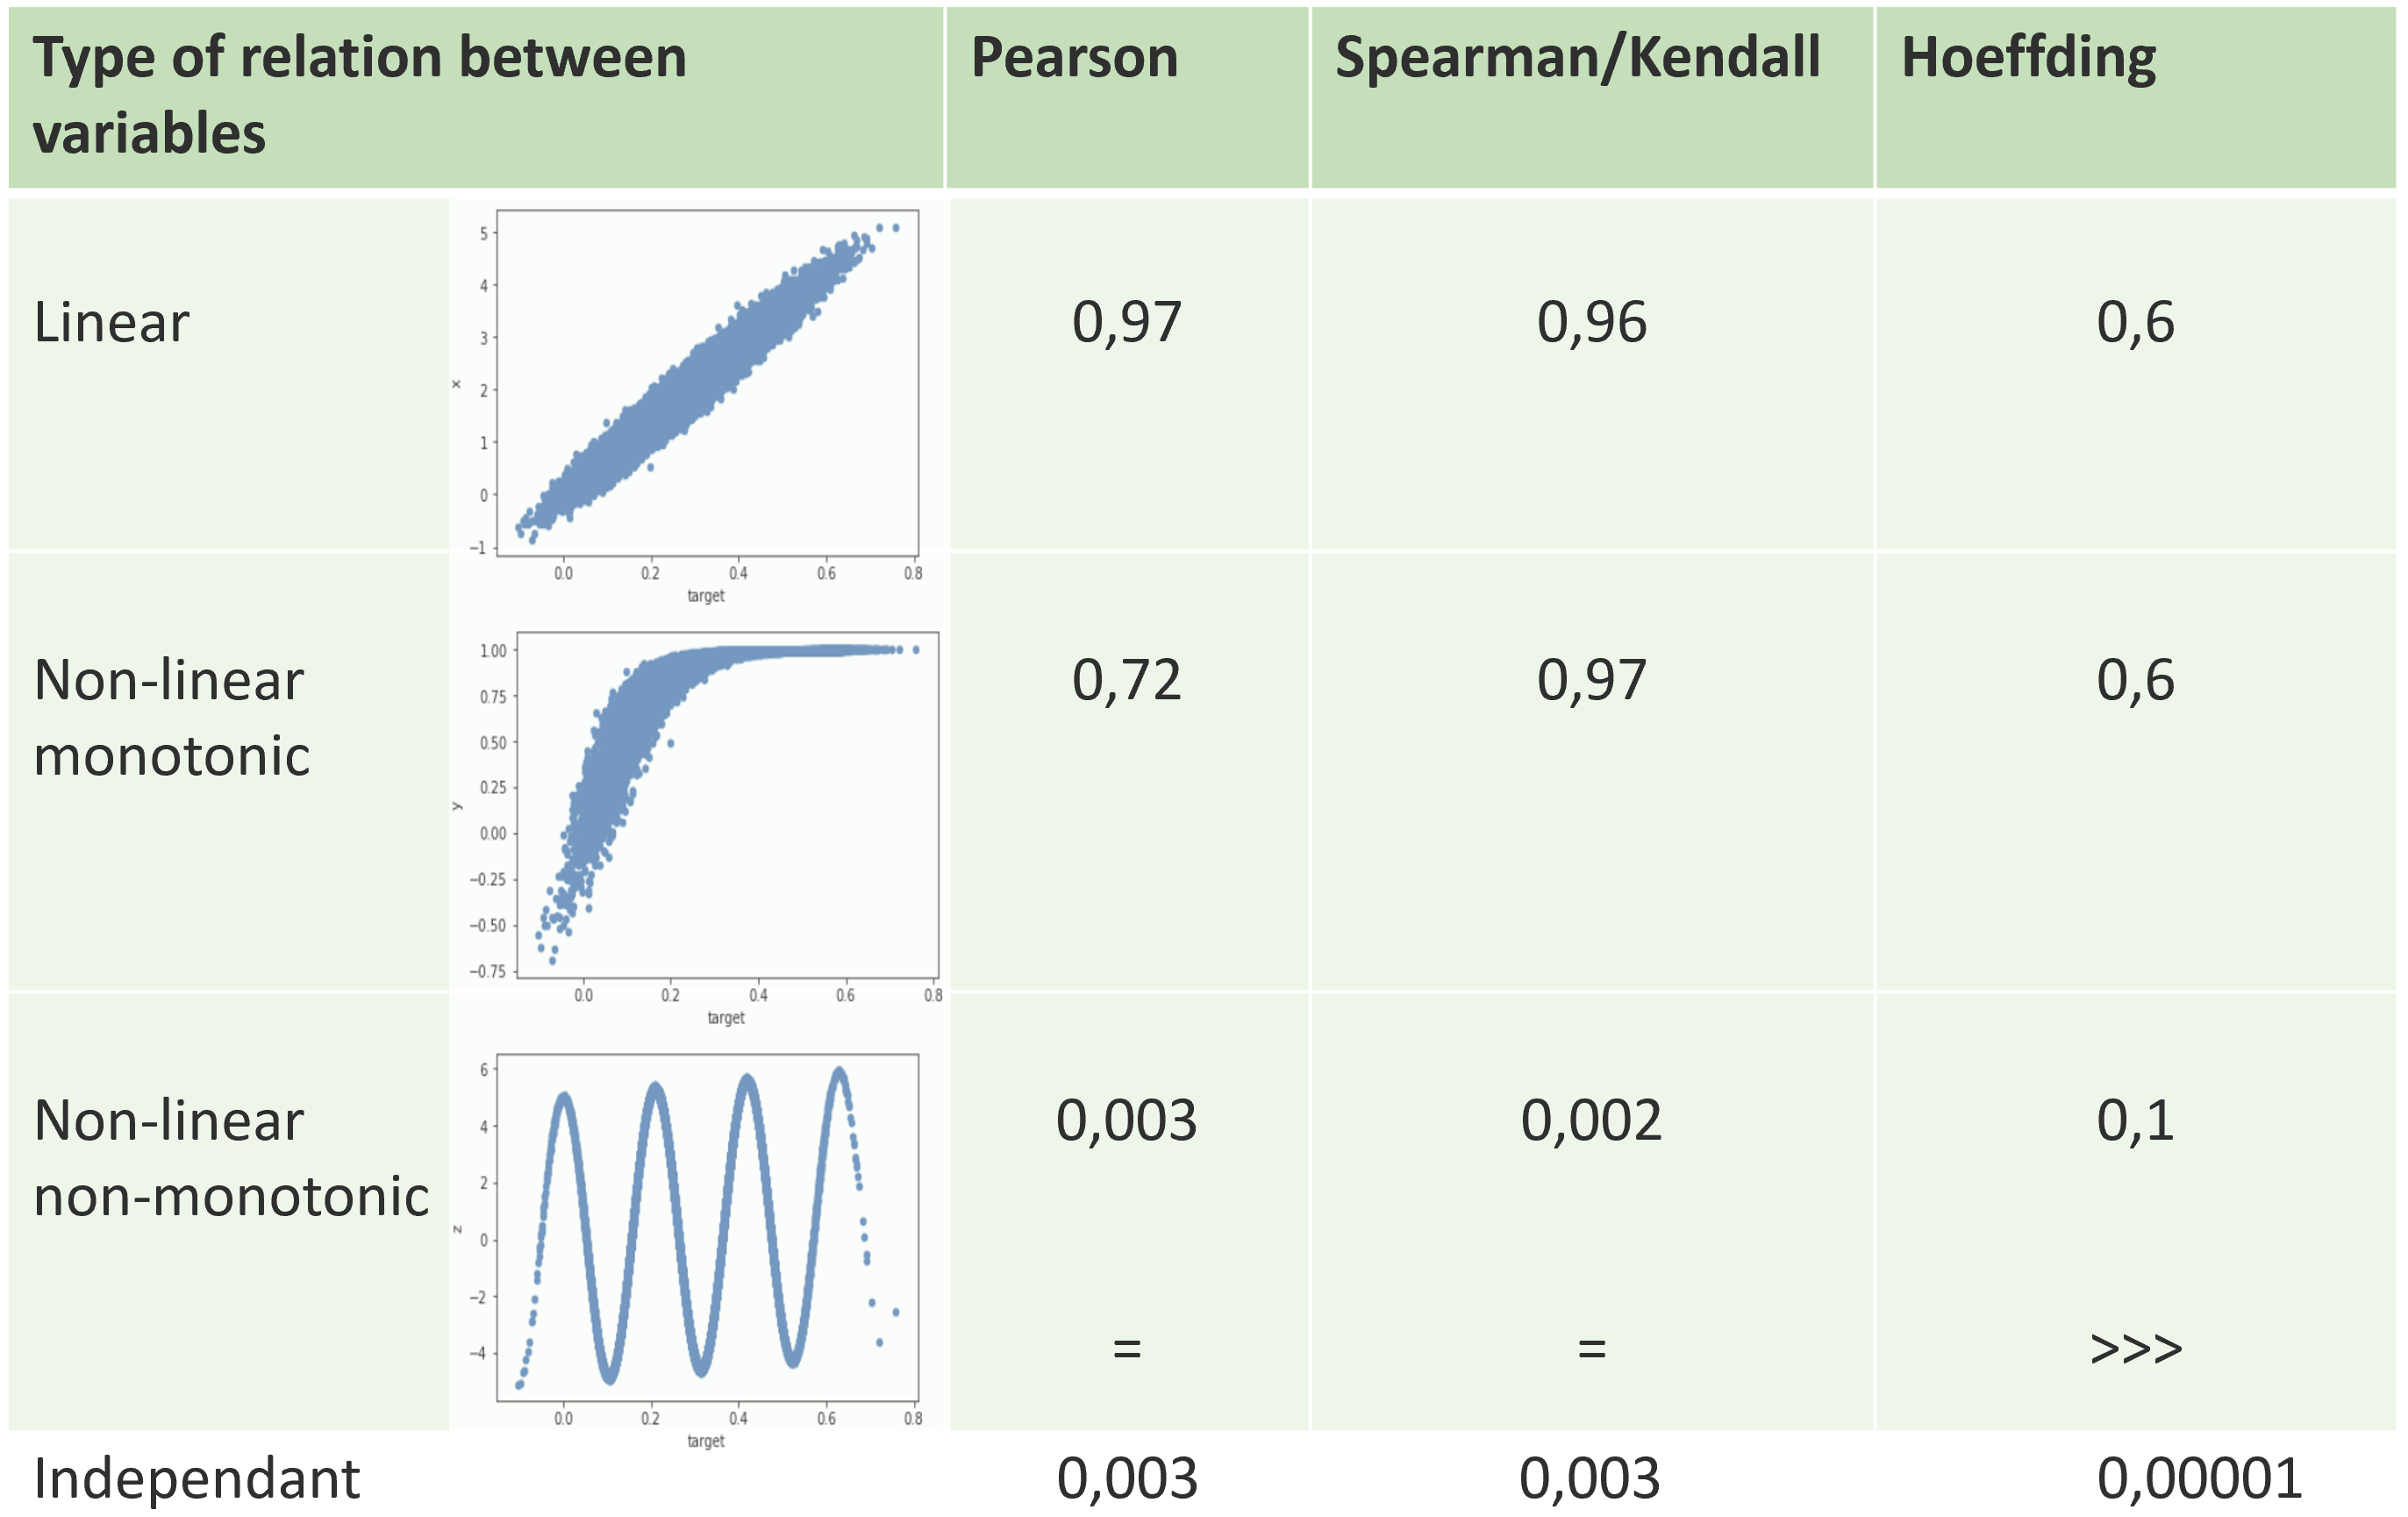
The graph below gives measured coefficients for the tested relations. The interesting point is the discriminative behaviour between a complex non-monotonic relation and pure independance.
-> Download & Import XtendedCorrel.py
import numpy as np
from  XtendedCorrel import hoeffding

x=np.random.randint(70, size=200000)
y=(np.random.randint(70, size=200000)*x)
df=pd.DataFrame({ 'x': x, 'y': y } )

# Direct on numpy series
hoeffding(x,y)
#out: 0.19021676396645915

# Pandas dataframe as input
hoeffding(df)
#out:
#        x	        y
#x	0.944652	0.188405
#y	0.188405	0.950448

# hoeffding(x,x) not equal to 1 :
#From SAS explanations : "When ties occur, the statistic might result in a smaller value. That is, for a pair of variables
#with identical values, the Hoeffding’s D statistic might be less than 1"

#If pandas version > or =  to 0.24
#as callable method in pandas.corr function similar to df.corr( ʺpearson ʺ) or df.corr( ʺSpearmanʺ)

df.corr(method=hoeffding)

#out:
#        x	        y
#x	1        	0.188405
#y	0.188405	1

# hoeffding(x,x) equal to 1 : Forced by corr() function
https://stackoverflow.com/questions/9270496/ideas-for-gpu-implementation-of-hoeffdings-d-dependence-coefficient/9322657#9322657 -> Code in matlab
http://support.sas.com/documentation/cdl/en/procstat/67528/HTML/default/viewer.htm#procstat_corr_details07.htm -> Formula proposed by SAS HoeffdingD is proposed as non-parametric correaltion method in SAS and in JMP softwares
pandas-dev/pandas#22086 -> a request for hoeffdingD in pandas
https://www.ncbi.nlm.nih.gov/pmc/articles/PMC4539721/ -> more explanations on the need for non-pearson correlation methods
http://math.furman.edu/~dcs/courses/math47/R/library/Hmisc/html/hoeffd.html -> statistical explanation
https://stats.stackexchange.com/questions/20011/can-the-mic-algorithm-for-detecting-non-linear-correlations-be-explained-intuiti ->more discussion and comparison with MIC algorithm - Mutual Information Coefficient
https://journal.r-project.org/archive/2018/RJ-2018-057/RJ-2018-057.pdf
https://www4.stat.ncsu.edu/~boos/library/mimeo.archive/ISMS_1994_2310.pdf -> Essay on contribution of Wassily Hoeffding to statistics and probability