Setting up a Monte Carlo simulation in order to estimate the most probable matches that will be drawn from the Champions League draw, under its facing rules regarding nationalities,previous encounters and groups position for each team.
The group stage involves eight groups of four teams, with each club playing everyone else in that group home and away. The top two sides in each group move on to the round of 16 and the start of the knockout phase, while the third-placed team drops into the UEFA Europa League. Below, the picture shows last year Group Stage results:
After the Group Stage, the 16 teams that are left enter the Knockout stage and a special draw takes place, which will announce the following 8 matches from these teams, reducing the size of teams to 8, which are the winners of the drawn matches. To study the probabilities of each match to be drawn, it is essential to understand the three rules that govern this draw:
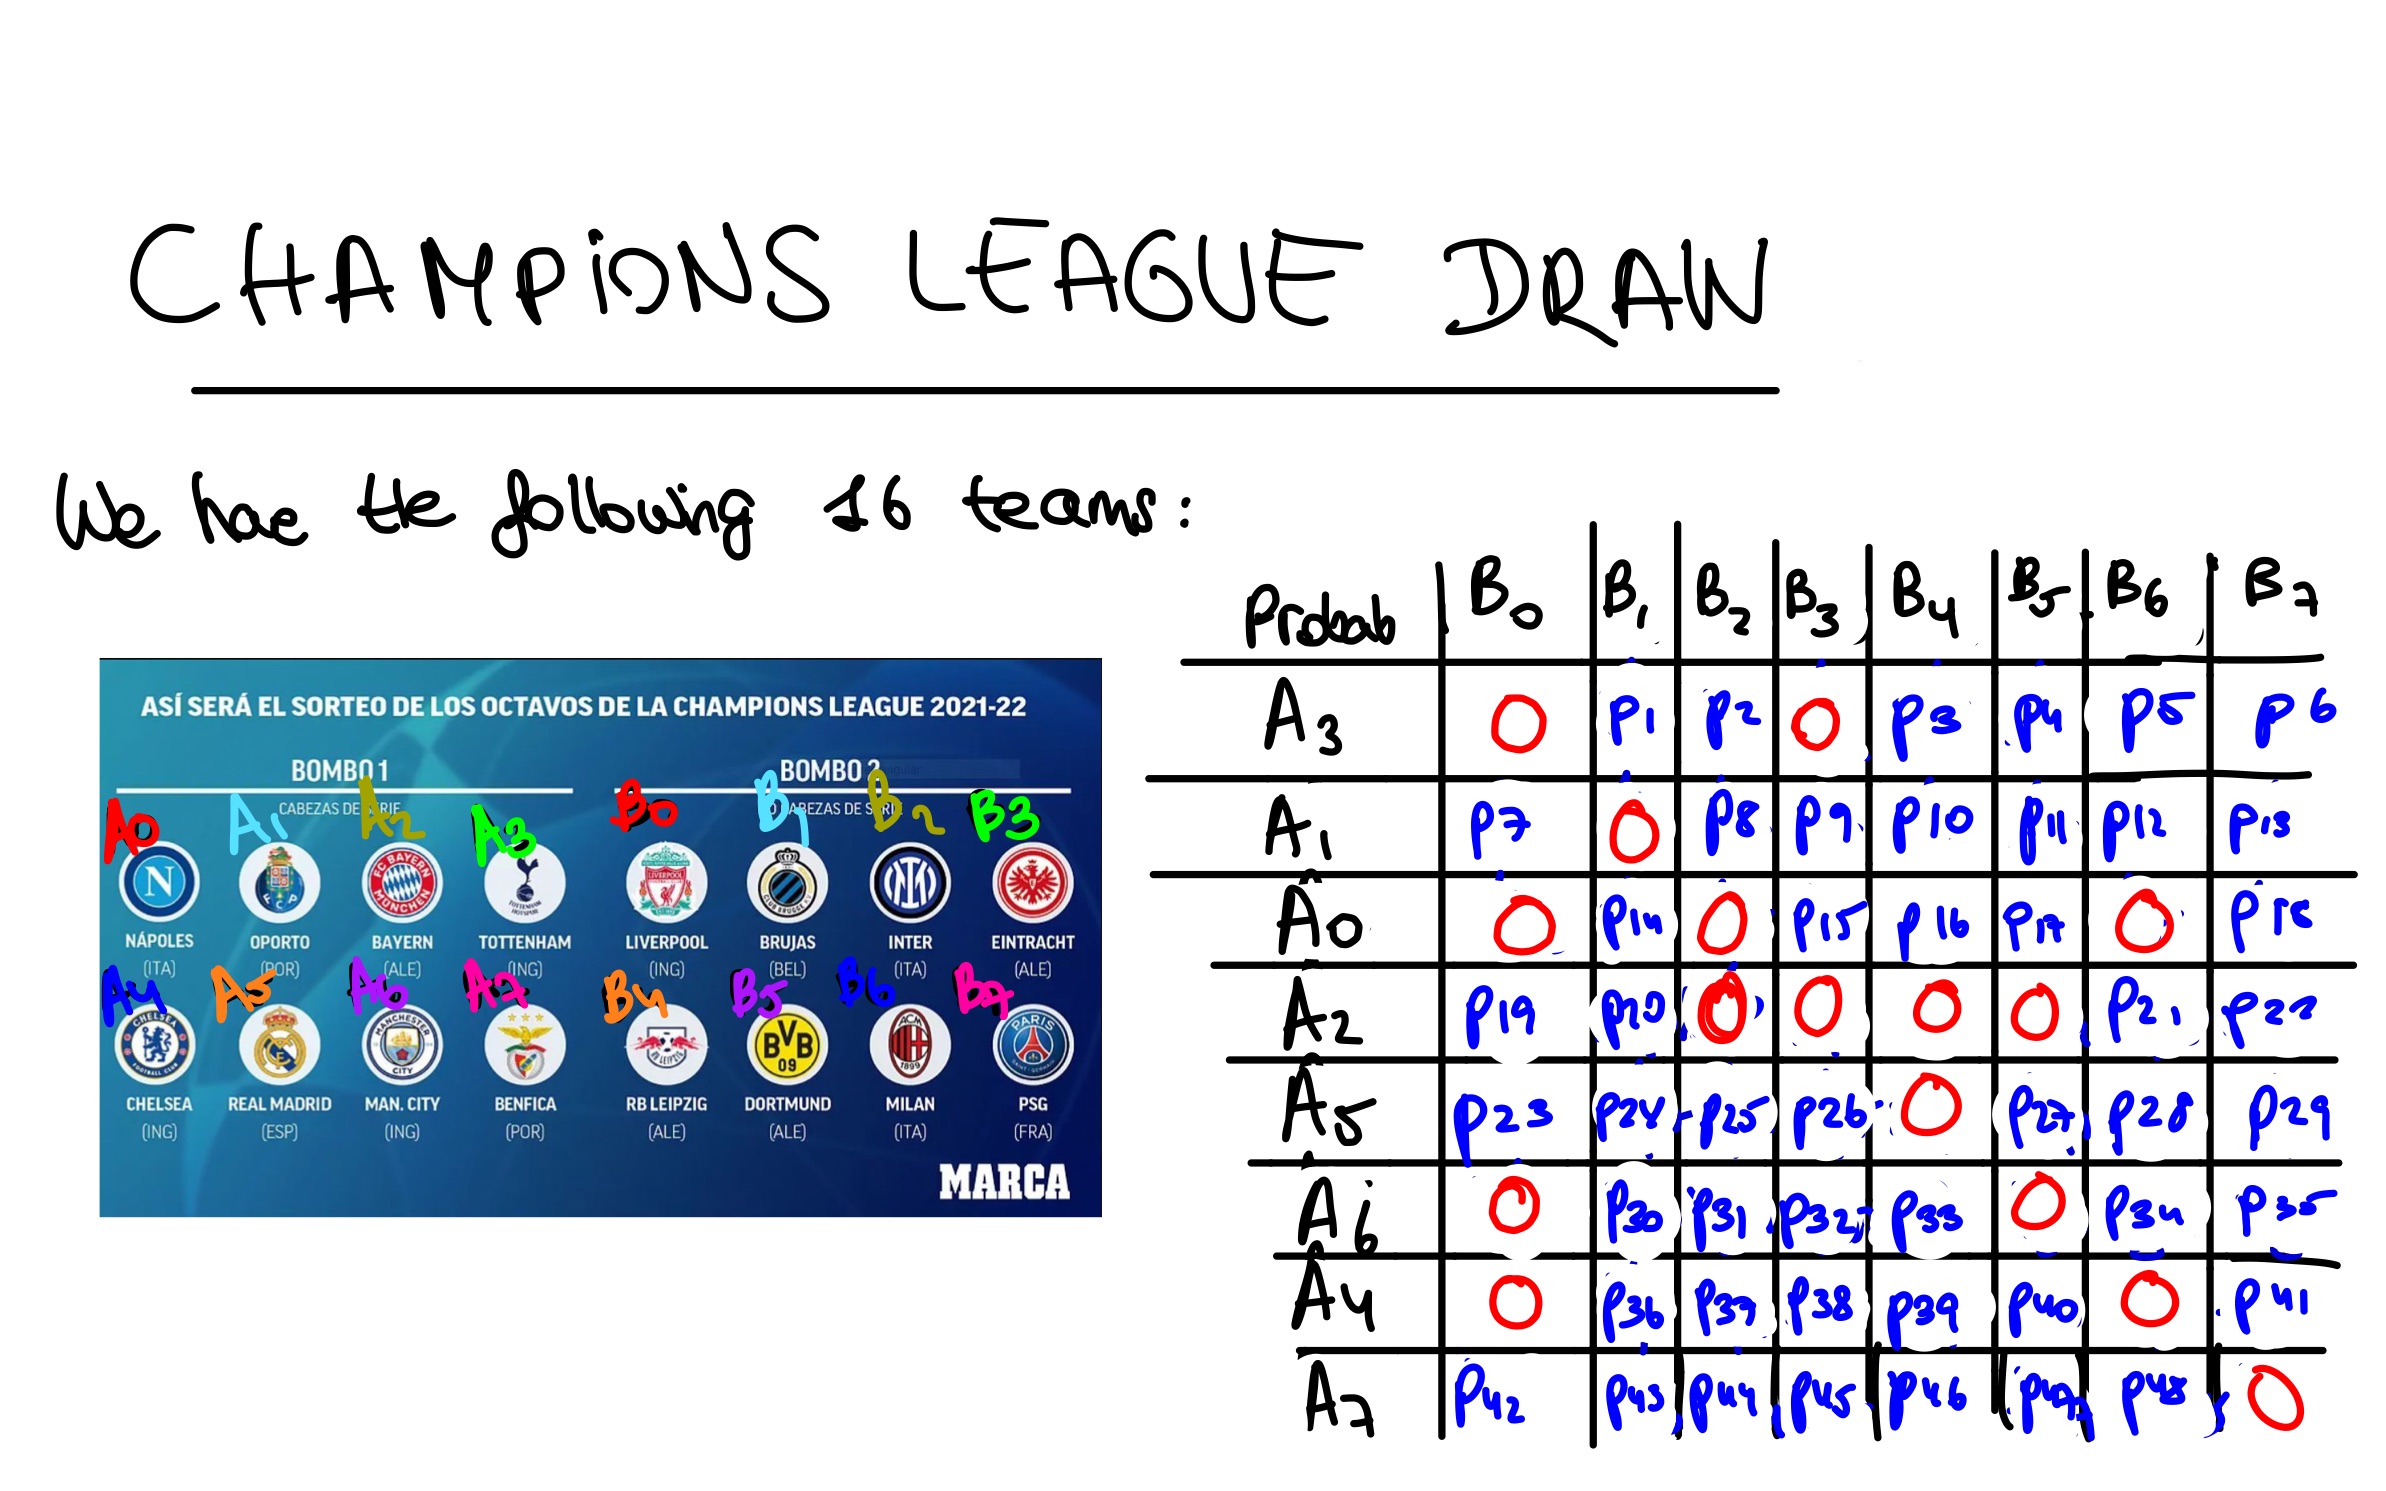
- Teams are initially separated into two bowls: Group 1 bowl and Group 2 bowl The match ups are made always so that a group 1 team ends up facing another one (if further rules mentioned later are also satisfied) from group 2. Teams from the same group never face each other! Note: Keep in mind from the picture below that there are 16 teams in the beginning of the tournament; 8 for each bowl. Look at the picture below to see the example for this year draw.
- Teams from the same country (or league, equivalently) are not eligible to play against each other.
- When picking up a team from bowl 1, an empty bowl is filled with teams from bowl 2 (since these are only possible candidates for bowl 1 teams, as stated on Rule 1) which also,by Rule 2, they can only be those bowl 2 teams that do not play in the same nation in which the picked team from bowl 1 plays. This rule application can be seen in the right side of the picture below, inside that "Sudoku" looking table. I actually made this table as a way of naming and illustrating all possible matches for the 16 soccer teams. To understand this second rule, use the table to see that Chelsea (english team), represented on the table with the name A4, has 0 probability of being matched with Liverpool(also plays in England), denoted by the name B0 on the table. See that the entry (A4,B0) has a value of 0.
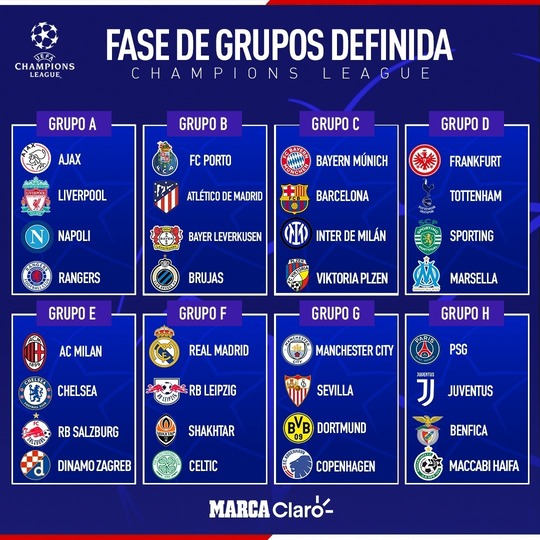
- This last rule is pretty easy: A team from bowl 1 is there because it has been a first position winner from some of the 8 groups during the Group Stage . Similarly, a team in bowl 2 has been a second position winner from some of the 8 groups during the Group Stage- Now, what rule 3 states is that no pair of winners (first and second positions ) can ever face each other. This pairs of Group Stage winners are colored equally in the picture below
See Rule 3 in action with the following example, based on the data from this last year:
After this year´s Group Stage, the pair (Real Madrid, Leipzing) was presented. Then, as Real Madrid is denoted by the name A5 and Leipzig by B4, check that the entry on the "Sudoku" table is 0, because as stated, the pair of teams that got classified on the same group during the Group Stage, have 0 probability of being matched up.
By combining the last two rules, see that there are impossibles match ups already, that is, with 0 probability. There are exactly 16 of these (check with the table)
Similar to a Sudoku, the structure of the table made is convenient for a reason : for each entry, the sum of the entries in its row must be 1. The same holds for the sum of the column entries. Therefore, we have 64-16 = 48 nonzero entries (unkowns) constrained by 2*8=16. This is called an "underdetermined system" and it may have infinitely many solutions or no solution (in any case, we know that the problem has a unique solution so this fact already hinted that the conditions were only necessary but not sufficient). However, note that there are another 48 nonnegativity constraints since the numbers are probabilities which makes a total of 48 variables and 68 equations. Sadly, the system turned up to have infinitely many solutions, as I proved by coding a Matlab script that performed Gaussian Elimination on the augmented matrix ( maximal pivoting variant to minimize roundoff errors) finding more than one solution. From this devastating conclusion , it was clear to us that the analytical approach was not going to be straight forward and we pivoted to a nummerical way of thinking -> Monte Carlo Simulation of hundreds of thousands of draws.
Relative frequencies approach probabilities as the number of repetitions of the experiment approaches infinity.Then, the probabilities of particular matches taking place this year can be estimated with an error less than any E>0, as long as we look at the relative frequency of that match after simulating N=N(E) tournament draws (N is expected to grow as E shrinks).
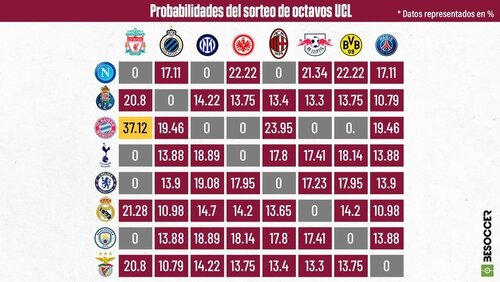
By keeping track of the results in each of the draws (incrementing by a 1 the appropiate entry in the matrix of all possible team combinations) and in the end dividing by 100000, the probabilities of each match were estimated to be:

which is surprisingly similar to the one's published by the sport magazine that motivated us to start this project (this is in percentage, ie: multiplied by 100) :