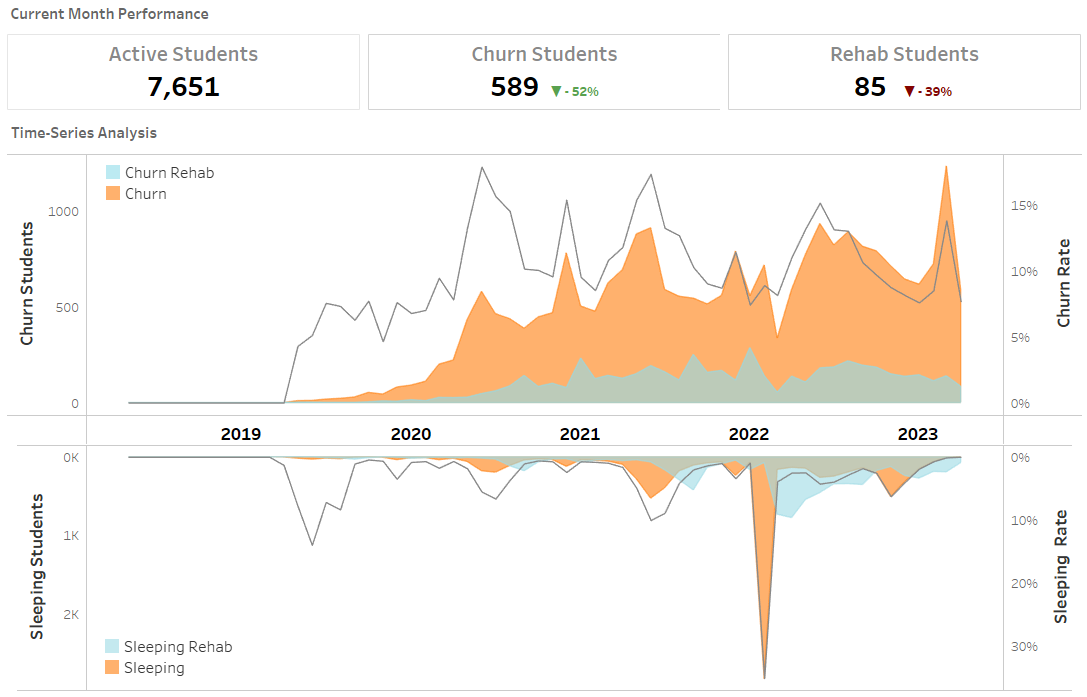
Time-series analysis of Churn and Sleeping students, as well as Resurrected Students out of all Active students for each particular month.
The primary goal of this project was to analyze students payment histories and lesson visitation patterns over time, enabling me to assess the number of active students, churn rates, and sleeping rates. The analysis provide the foundation for further understanding the reasons why students are leaving the school, with the aim of reducing the rate of student churn.
The most challenging part of the project was to track and update the balance for each student whenever events such as lesson attendance, purchases and other activities occurred. I collected information on 50,000 active students and 2,000,000 related events to achieve the goal. That allowed me to calculate cumulative balances for each student and each event.
- Active students - all students with scheduled lessons for the given month.
- Churn students - students with no lessons on the balance (considered as churn students if it's more than 8 days before next payment).
- Sleeping students - students with positive balance and paused visiting (considered as sleeping students if it's more than 30 days before next lesson).
- Rehab students - students switched back from churn status (Churn Rehab) or sleeping status (Sleeping Rehab).
The project implementation included the following main stages:
-
In this project, I utilized MySQL to query data and obtain information on all student transactions and lesson visits, allowing me to determine the balance of each student. Using this data, I identified students who were either churning, sleeping, or in a state of rehabilitation based on specific conditions. To aid in my analysis, I used Google Colab to write queries and create simple visualizations.
-
Next, I transferred my SQL code to Tableau and created a data model that established relationships with other relevant tables. This allowed me to filter data by specific products, lesson types, and other variables.
-
I used Tableau to develop a simple, yet effective, dashboard that displayed time-series visualizations of churn and sleeping students. To ensure that my data was up-to-date, I scheduled incremental data updates. By leveraging these techniques, I was able to gain valuable insights into the churn behavior of online school students.
-
Finally, I wrote detailed documentation that allows to effectively interact and maintain the dashboard.
The following list represents some of fuctions and techniques utilized within the project
- Calendar - to obtain results from different tables (lessons visited, lessons purchased, lesson statuses) the calendar table has been created as a separate CTE;
- Nested queries in FROM clause;
- Left Join, Full Join, Self Join;
- FIRST_VALUE(created_at) OVER(PARTITION BY student_id ORDER BY created_at ASC) AS first_payment_date;
- LEAD(created_at, 1) OVER(PARTITION BY student_id ORDER BY created_at ASC) AS next_payment_date;
- SUM(COALESCE(pd.nmb_lessons_paid,0) - COALESCE(ps.lesson_flag,0)) OVER (PARTITION BY ed.student_id ORDER by ed.event_day ASC) AS cum_balance;
While the analysis yielded insights into the dynamic of student churn, it did not reveal specific patterns or underlying reasons for churn.
To gain a deeper understanding of Students Churn, further analysis needed to examine impact of factors such as course content, teacher effectiveness, student demographics and other. This more in-depth analysis will help to identify potential causes of student churn and suggest ways to reduce it in the future.