nuse is a simple resource monitoring tool for SLURM jobs. It allows users to view the CPU and memory usage logs for individual jobs and the entire node. With nuse, when running a SLURM-based workflow, you can easily monitor resource consumption through command-line tools.
- Job-Specific Monitoring: Capture and view resource usage for each job (e.g., using cgroup filtering).
- Node-Wide Monitoring: Automatically collect a separate log for overall node usage.
- Command-Line Interface: Installed via pip, the
nusecommand lets you quickly view logs with a simple one-liner. - Custom Log Directory: Easily configure where logs are stored by setting the
MONITOR_LOG_DIRenvironment variable.
Install nuse directly from PyPI:
pip install nuseIn your script include.
from nuse import start_monitoring

start_monitoring(filter_cgroup=True)

# your codeINFO: You can set filter_cgroup to False to watch the entire node and not just your own job.
NOTE: You should include start_monitoring() in the script you submit to SLRUM. Don't put it in a submitit script.
Job-Specific Log: To display the resource usage log for a specific job on a node, run in your CLI:
nuse node305 49847516Here, node305 is the node's short name and 49847516 is the SLURM job ID.
Log Directory:
- By default, nuse stores logs in the directory ~/.monitoring. To change the log directory, set the environment variable before running your jobs:
export MONITOR_LOG_DIR="/path/to/your/log_directory"When included in your SLURM job pipeline (via start_monitoring(filter_cgroup=True) from the nuse package), nuse will:
- Create a job-specific log file with a naming convention like cpu_memory_usage_.cluster_<SLURM_JOB_ID>.log.
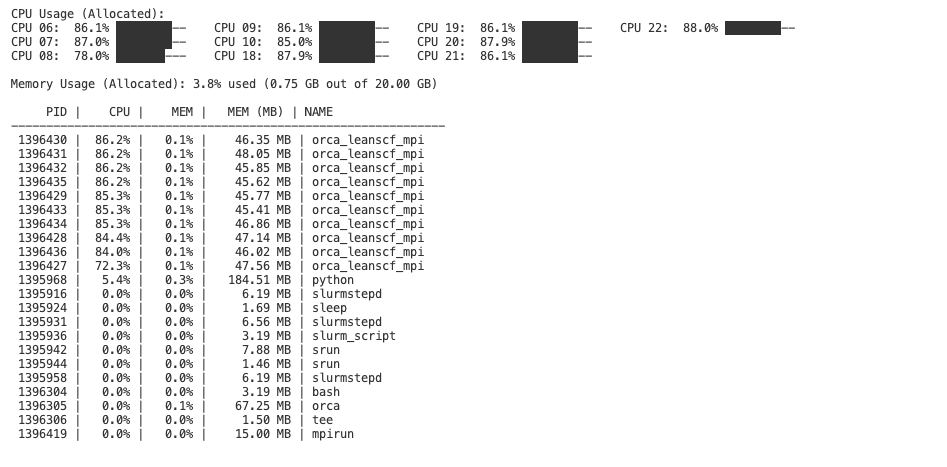
Then, the nuse CLI tool uses these logs to provide an easy-to-read, real-time view of resource usage.
Happy monitoring!
nuse clearto remove the monitoring directory. Until then just delete the ~/.monitoring folder.