Microsoft intends to venture into creating original video content. They have decided to set up a movie studio in charge of creating movies. However, since they are new to this industry, they have tasked a data scientist to advice on what film they should make.

The task at hand is to explore what type of films are currently doing the best in the industry and tratranslate the findings into actionable insights that the head of Microsoft's new movie studio can use to help decide what type of films to create.
Successful movies frequently depend on a variety of elements, including genre, audience preferences, and market trends, as the film industry is quite competitive. The goal of the data analysis will be to determine the best strategy for helping the studio choose genres and topics that are likely to optimize their chances of success and return on investment. By clearly understanding what kinds of movies are currently succeeding at the box office, Microsoft's new movie studio will be able to:
- reduce risks by coordinating their output with established market patterns.
- maximize audience involvement and revenue.
- Create a solid basis for success in the cutthroat industry of filmmaking.
)
- To determine the most popular genres in the current market
- To determine the relationship between genre and popularity
- To determine the impact of release dates on the performance of a movie
- To identify competition in the market
- To provide insight on the type of film to create
- To provide recommendations and next steps for the business
There were 5 sources of data provided which were:
The project utilises data from 3 sources:
- IMDB database files;
movie_basicsandmovie_ratingstables bom.movie_gross.csv; a CSV filetmdb.movies.csv; a CSV file
IMDB database
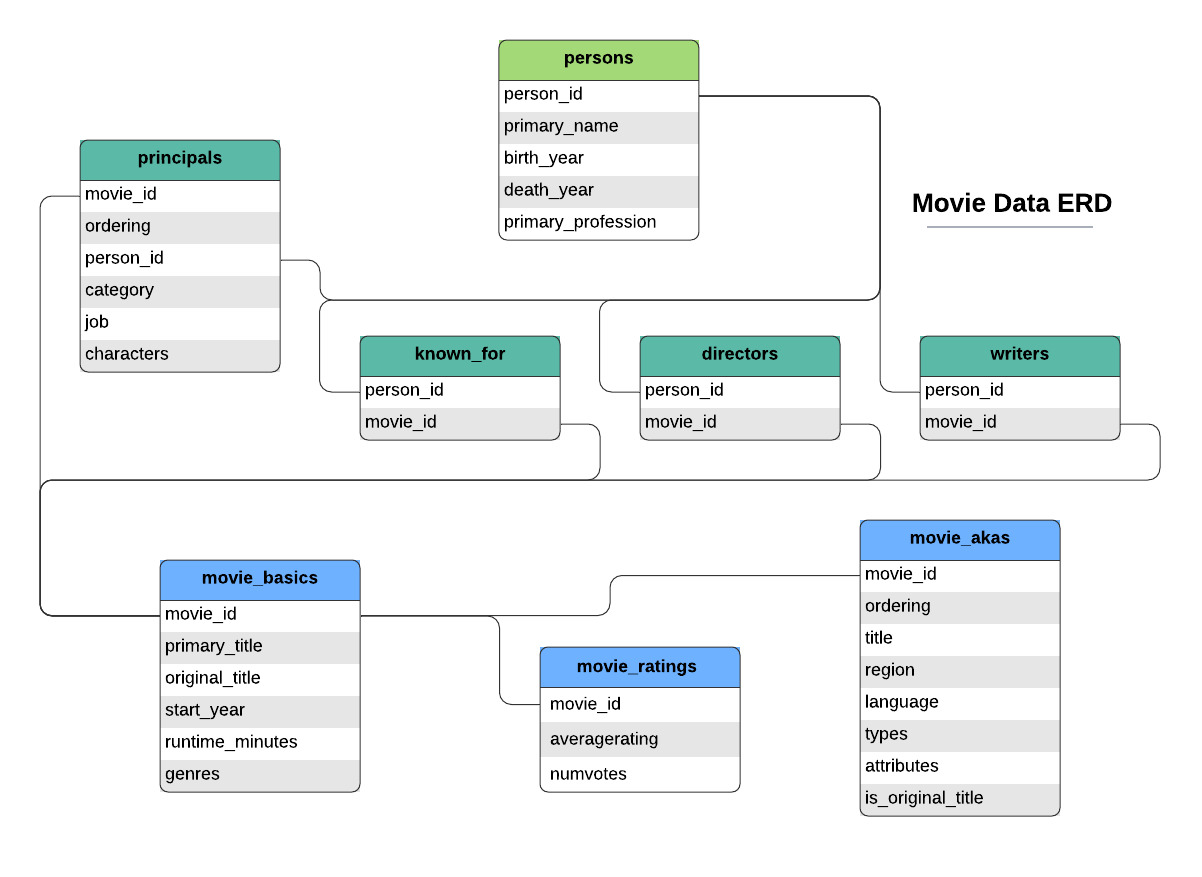
The movie_basics table had 146,144 rows and 6 columns. Each row had the following information about a single movie:
['movie_id', 'primary_title', 'original_title', 'start_year', 'runtime_minutes', 'genres']
They constitute the columns of the table.
From this table, the columns of interest were movie_id, runtime_minutes and genres
From the movie_ratings table, there are 3 columns: ['movie_id', 'averagerating', 'numvotes'] The column movie_id is the common key for both tables. The two tables were then combined into a joined table called combined_data_table with the following columns of interest:
['movie_id', 'runtime_minutes', 'genres', 'averagerating', 'numvotes']
bom.movie_gross.csv
tmdb.movies.csv
The analysis starts with connecting and opening im.db database to access the tables movie_basics and movie ratings.
movie_basics
['movie_id', 'primary_title', 'original_title', 'start_year','runtime_minutes', 'genres']
From the columns above, the columns of interest chosen were runtime_minutes and genres. The reason for this selection:
- To determine the popular genres in the current market
- To determine the appropriate runtime for the movie.
movie ratings
['movie_id', 'averagerating', 'numvotes']
From the columns above it can be noted that there is a common column, movie_id. The two columns, average_rating and numvotes can help assess the popularity of the movie based on its genre and runtime.
The next step in the analysis was to join the two tables using the PRIMARY KEY, movie_id to create a new table new_joined_table which will have the columns:
movie_id, runtime_minute, genres, averagerating, and numvotes
The goal of analysing this table is:
- To determine the most popular genres among the movies with the highest ratings
- To determine the appropriate runtime for the movie
The next step after deciding the data to use in our analysis is Data Cleaning which entails cleaning the data to deal with any missing values or ambiguous values and checking for outliers.
    # code to check for rows with missing values

    missing_values = df.isna().sum()
    print(missing_values)

    Output:
    movie_id              0
    runtime_minutes    7620
    genres              804
    averagerating         0
    numvotes              0
    dtype: int64
Only the columns runtime_minutes and genres had missing values and the corresponding rows were dropped.
The next step was checking for outliers
Determining the relation between Runtime in minutes and Average rating

From the plot above:
-
Majority of the films have a runtime of between
40to200minutes -
Majority of the shorter films had higher rating
-
Does the data suggest that a shorter film has a higher chance of having a higher rating?
-
Majority of the longer films also had higher ratings
-
Does the data suggest that a longer film has a higher chance of having a higher rating?
Further analysis clarified this. We were able to see that :
- the short films had wat less number of voters meaning it had a smaller audience.
- The film that had the largest number of audience had a runtime of the majority of the movies
Upon zooming into the films with shorter runtime. It clarified for us that despite the shows with less runtime_minutes of 40 minutes and below, majority of them with a higher rating of 6.0 to 9.5, they typically have a really small audience of less than 100 votes.
Our objective got more defined to:
- To make a film that will attract a large audience and recieve a high rating feedback.
- To give correct insight to Microsoft on the runtime the movie should have to reach a larger audience and have a higher rating.
The runtime clearly had an effect on the size of the audience therefore I worked with data that has higher number of votes and higher ratings.
Determining the relation between numvotes and rating

In the above plot, we can see that majority of the movies with higher ratings have a smaller audience. So we shall focus on the films with higher rating and a larger audience, and runtime ofbetween 80 to 200 minutes.
**Note**: It can be determined as at now, the suggested runtime of the movie should be between `80` and `160` minutes, which is anywhere between 1 hr 20 min to 2 hours 40 min.
I narrowed down the interest to only those films that are doing well in the market because those are the films we want to learn from.
The next item on our objectives list is to determine the genre(s) the film will fall under.
To do this, we checked the most recurrent genres of the selected films and saw which one(s) had a higher popularity based on the size of the audience i.e. the numvotes column and rating i.e., averagerating column.
Determining the relation between Genre Frequency and Mean Votes

From the above plot, it could be noted that:
-
The most frequent genre had a large audience in comparison to the other less frequent genre groups
-
There are also genres that are rather frequent but with a smaller audience size
-
There are genres with a large audience but less frequent, especially those with a frequency of 1
**Note**: It can be determined as at now, the suggested genres of the movie should be `action`, `drama`, `adventure` which reccurred frequentlu throughout the analysis
bom.movie_gross.csv
The analysis of this data was compared to our previous combined table. After comparing there was data in the two separate tables that matched. I added the movie_id column to the bom.movie_gross.csv table to prepare for comparing it to our combined id.mb tables from the previous section
The next step added the domestic_gross and foreign_gross columns to df table that had been combined in the previous section.
The columns will answer the question:
- What is the performance of the genres in terms of gross revenues?
Including one more table of interest below that has beneficial data to our objective.
tmdb.movies.csv
After comparing, the column release_date was merged to our previously combined table. After the analyses of the combined table, Our new df had 9 columns.
The additional 3 columns, foreign_gross, domestic_gross and release_date will help us determine:
- The relationship of revenue to popularity

- The relationship between release months and revenue to establish the appropriate release date which is part of our objective

Conclusoions After performing the analysis on the data, the following are the conclusions
- The suggested movue runtime to be between 80 to 160 minutes
- The suggested genres are Action, Drama, and Adventure
- The suggessted release month is either January and December, during the holidays
The above suggestions showed to return a higher rating, have a large audience, and a higher gross revenue.
Recommendations
I would recommend performing analysis with outlier outlier on the higher end to go for exeptionality
Also, points to check to identify competition could be studios that are consistent in producing high rating high gross revenue films