Excel file attached for the analysis: https://github.com/Malvi1497/Stock_analysis/blob/main/VBA_Challenege.xlsm.xlsm
The purpose of the project is to analyse the given stock information for the year 2017 and 2018 to understand which stocks are worth investing on with the help of VBA. This is done by first retriving each ticker and then calculating the total volume for each ticker and the yearly return. The code is refactored in a way to increase the time efficiency of analysing the data.
The analysis was performed on the VBA editor using the information given. The data given for the years 2017 and 2018 include,
- Ticker Index
- Date of issue
- Opening price
- Closing price
- Adjusted price
- Highest price
- Lowest price and
- The Volume of the stock
The results were displayed in the excel sheet. The cells were formatted to be shaded in green if there was an increase in the yearly return of the ticker and if there was a decrease the cell will be shaded in red. This helped the client visualize the data better as shown in the images below.
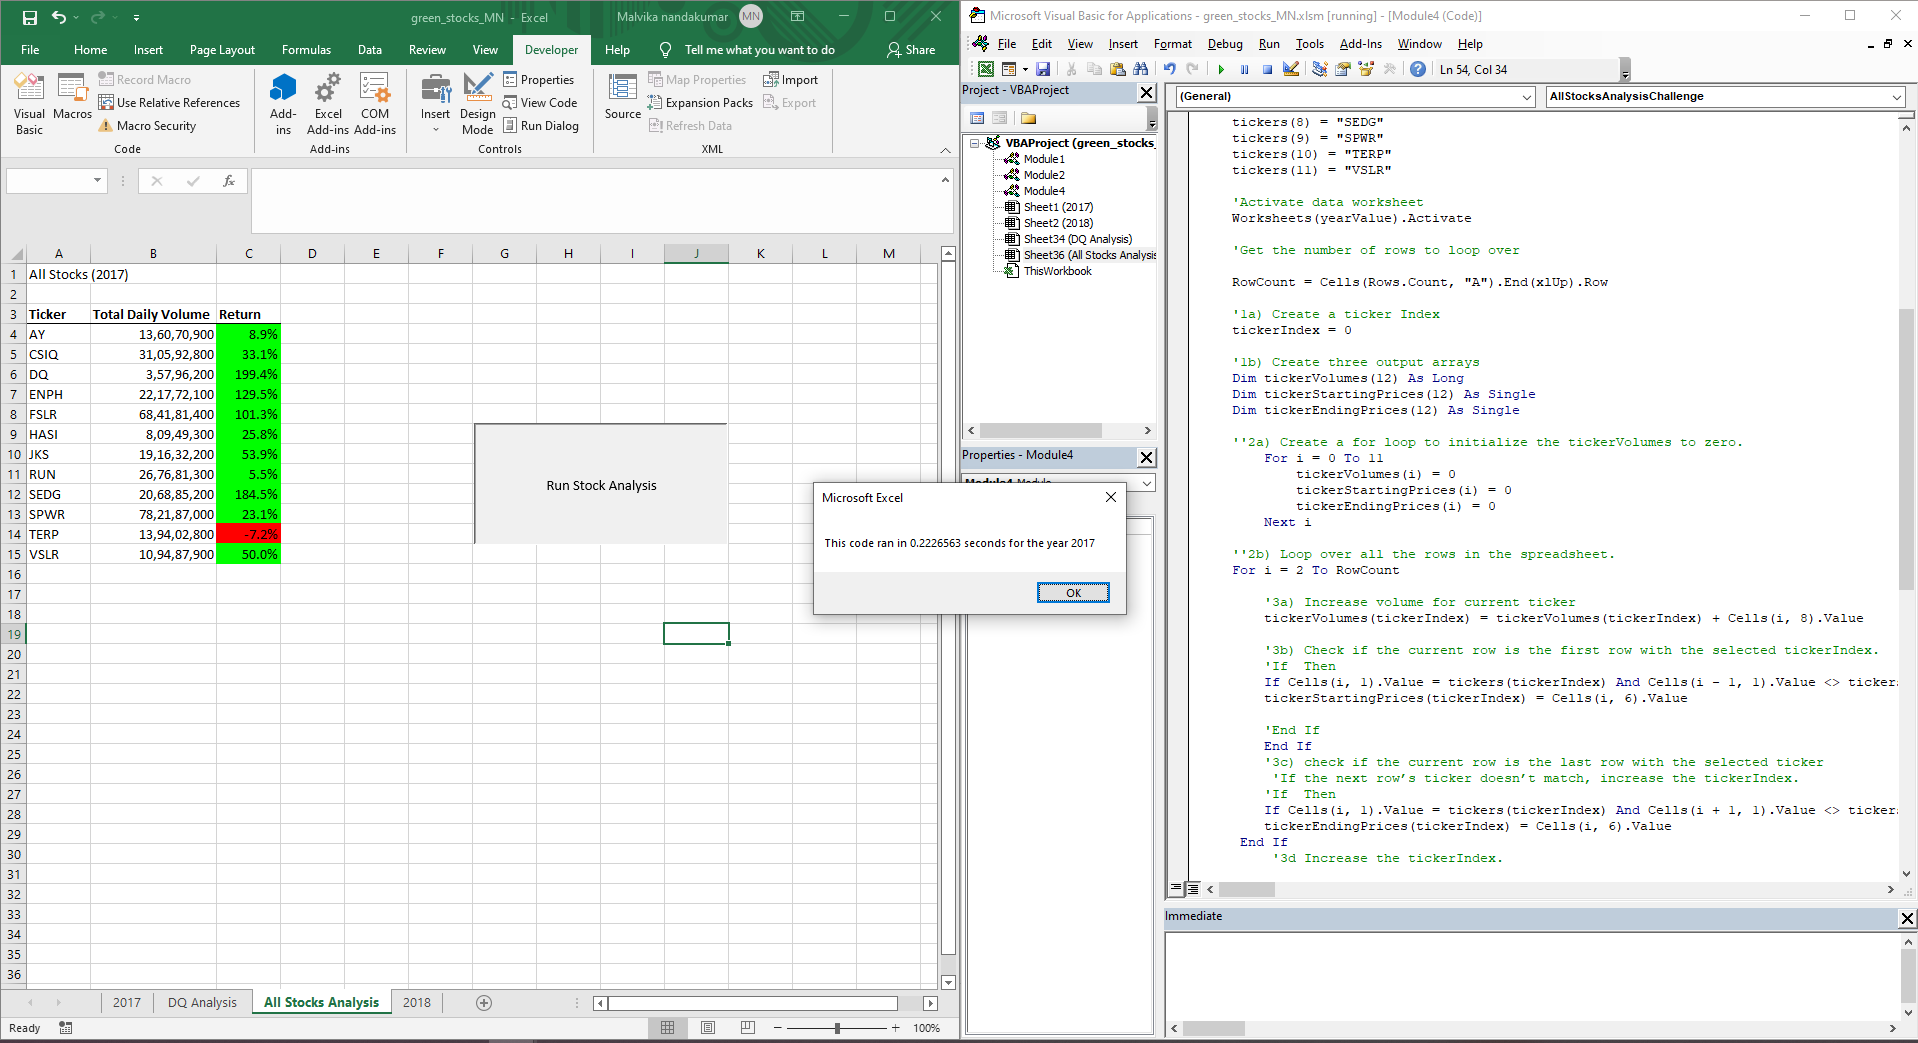
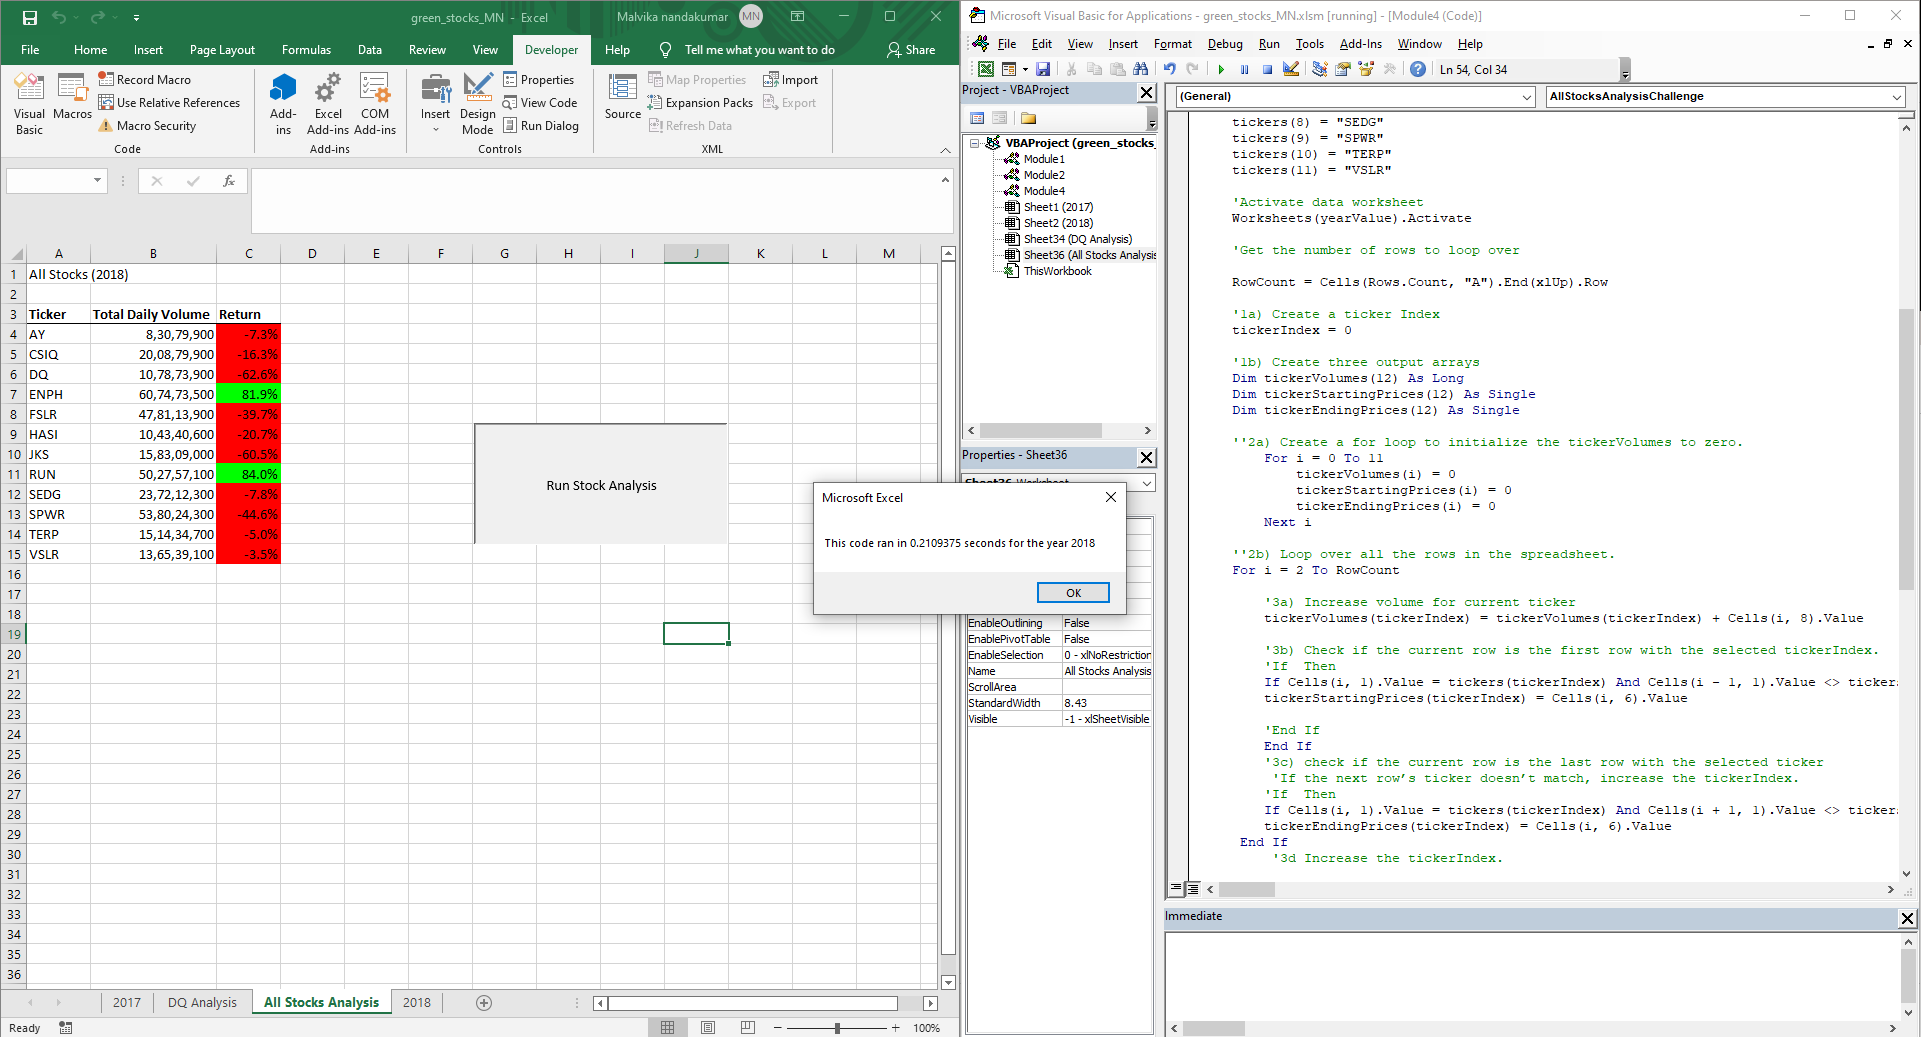
From the results we can observe that 2017 was really good year for investing execpt for the ticker "TERP" whereas in 2018. The client was particulary interested in the stock "DQ" which rose drastically in the year 2017 and the stocks fell drastically during the course of next year. The stocks took a major hit in the year 2018 except for "RUN" and "ENPH".
The advantages of refactoring the code for this analysis was cleaner and very well organised. The biggest advantage of refactoring the code was to show, with the help of a timer,that the code ran within .5 seconds for both years.
The pros of refactoring the code are it helps in running the code in a clean and quick manner. It helps to organize the code in a way to understand it. However, the disadvantage is that it can become messy if the application is too big.