![]()
The Wireshark for the Model Context Protocol (MCP)


See what your agent sees.
Reticle intercepts, visualizes, and profiles MCP JSON-RPC traffic in real time — designed for microsecond-level overhead.
Quick start · Install · Docs · Security · Contributing
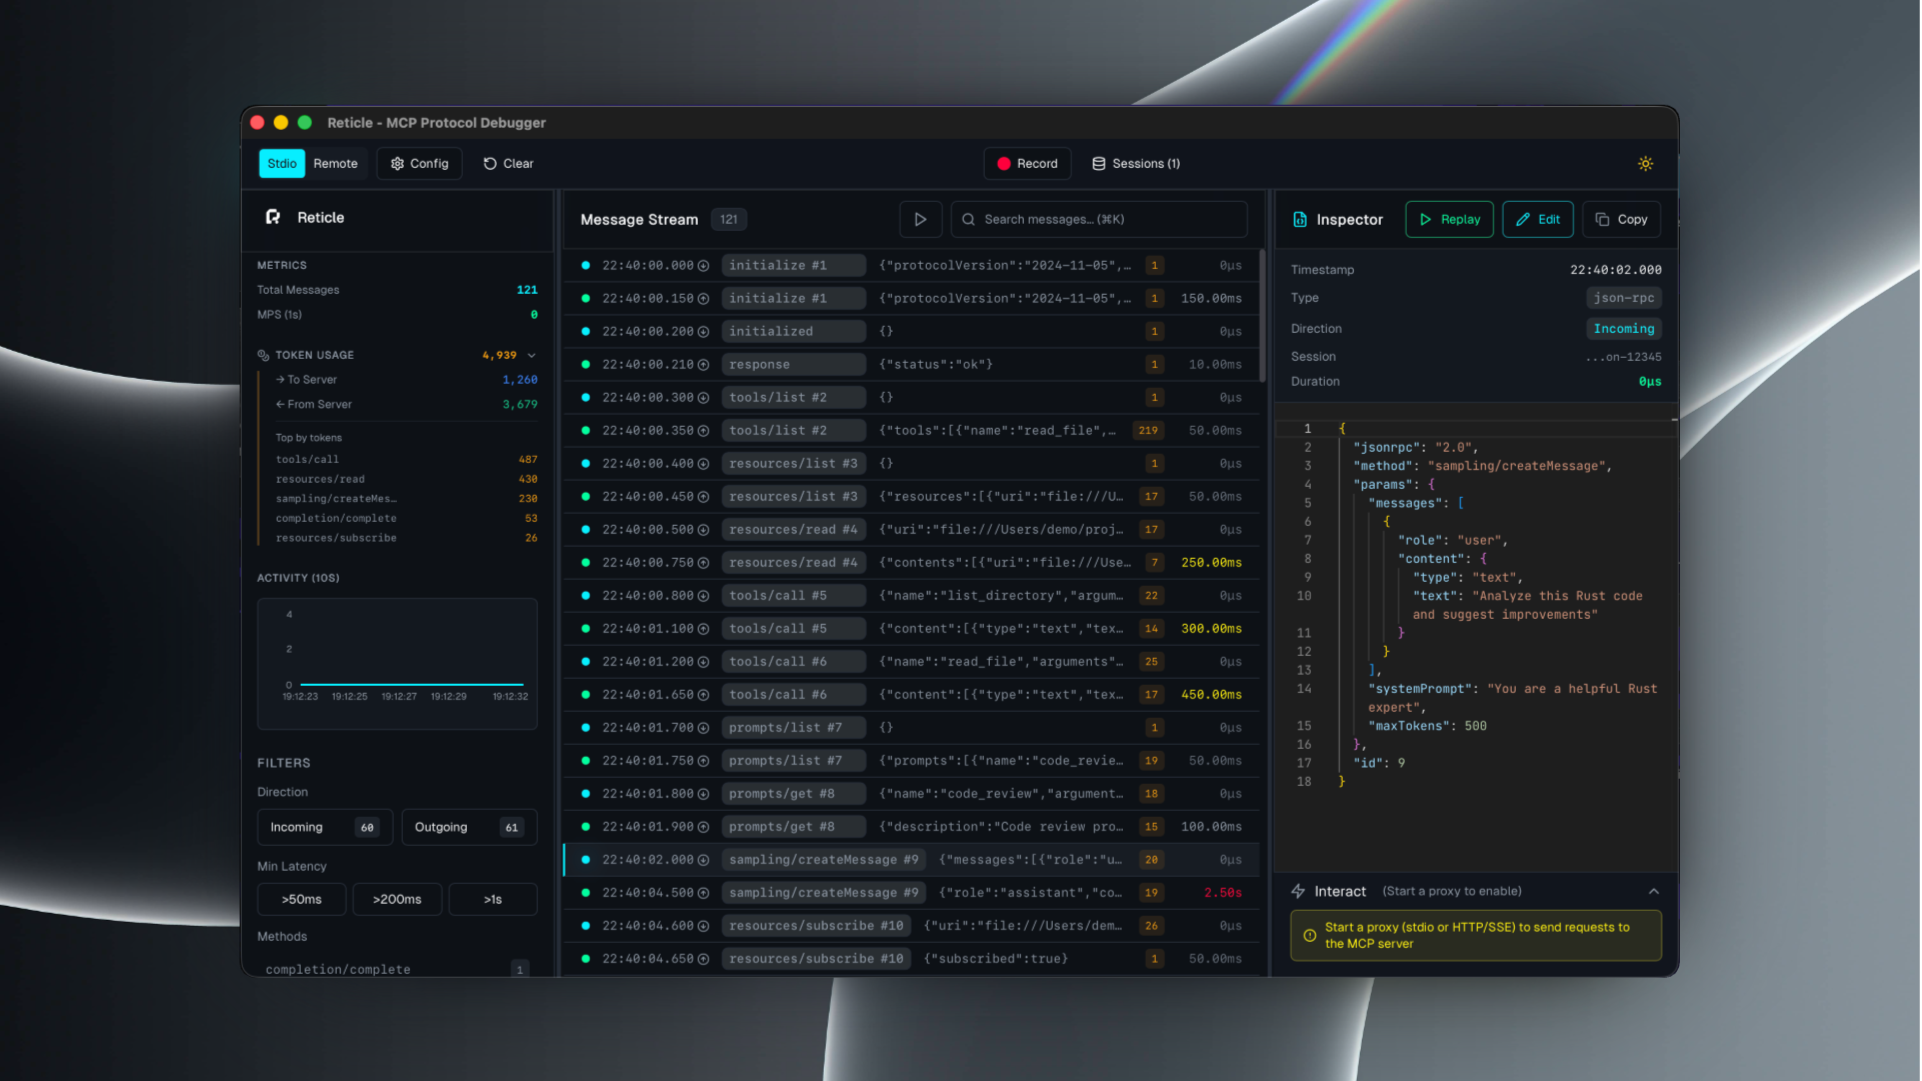
Reticle is a proxy + UI for debugging MCP integrations:
- inspect raw JSON-RPC messages (requests / notifications / responses)
- correlate request ↔ response instantly
- profile latency and token estimates
- capture server stderr and crashes
- record sessions and export logs
Supported transports: stdio, Streamable HTTP, WebSocket, HTTP/SSE.
# npm
npm install -g mcp-reticle

# pip
pip install mcp-reticle

# Homebrew
brew install labterminal/mcp-reticle/mcp-reticleReplace your MCP server command with mcp-reticle run --name <name> -- <command...>.
Example (Claude Desktop-style config):
{
  "mcpServers": {
    "filesystem": {
      "command": "mcp-reticle",
      "args": ["run", "--name", "filesystem", "--", "npx", "-y", "@modelcontextprotocol/server-filesystem", "/Users/me/work"]
    }
  }
}mcp-reticle uimcp-reticle run --log -- npx -y @modelcontextprotocol/server-memorymcp-reticle proxy --name api --upstream http://localhost:8080 --listen 3001If you prefer building from source:
git clone https://github.com/labterminal/mcp-reticle.git
cd mcp-reticle
just buildAll guides and deep dives are in the GitHub Wiki:
- Getting started
- CLI reference
- Client configuration
- Troubleshooting
- Architecture
- Security & privacy
- Development
- Exports
| Command | Purpose |
|---|---|
mcp-reticle run |
Wrap stdio MCP servers and inspect traffic |
mcp-reticle proxy |
Reverse proxy HTTP/SSE/WebSocket transports |
mcp-reticle ui |
Launch the desktop UI |
mcp-reticle daemon |
Headless telemetry hub |
Full details: CLI reference
Reticle can capture tool inputs/outputs and server stderr. Treat recordings and exports as sensitive artifacts.
Recommended reading: Security & privacy
- Repo guidelines:
CONTRIBUTING.md - Dev setup and commands: Development guide
MIT — see LICENSE.