Histogram bug fixes #64
Conversation
…`drawPlotLines` for the various renderers before rendering anything and add missing image verification to tests.
…howed values with too many decimal places due to numeric error.

In reality this just decreases the possibility of this happening again by reducing an extra division followed by a multiplication by the same value, which in some cases would result in loss of precision to the point where the string representation also had to change and show more decimal places.
We should in the future round the number to a certain number of decimal places by default and give the user control over it.
…igned with the grid/markers

And at the same time reveal a bug with drawing rectangles that touch each other where the x coordinate is not a whole number.
When rendering with raster renderers this results in white lines with differing widths.
…edges due to previous commit.

This is the easy approach, in the case of multiple series the colour of the series in the back might/will bleed through the edges of the one in the front, even when/if there are no columns of the back series nearby.
Also refactored the code inside `drawData` slightly for better code reuse between `.bar` and `.step` cases.
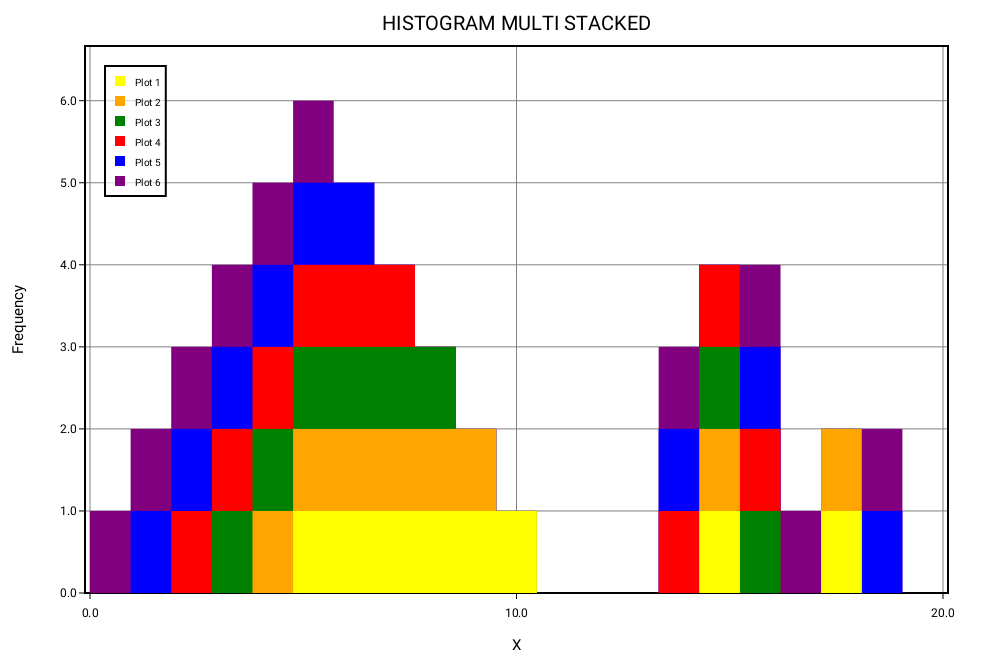
6 series, all the ways to pair 6 different colours side by side.
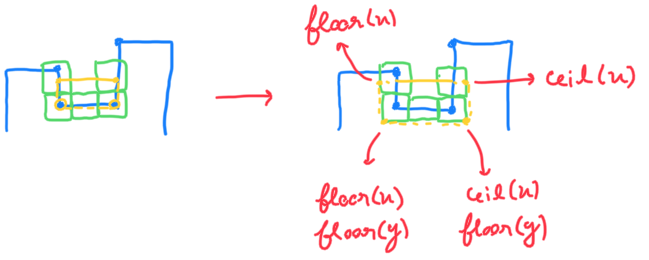
… some edges due to the last commit, this fixes that with an improved algorithm.

This is the same idea as with the `.step` case, using conditions and rules to decide what points to add to form a polygon. In this case "tucking" the background series a little behind the foreground one by `floor`ing or `ceil`ing the right points.
Also improved the algorithm for `.step` by removing one "instruction" and reducing the cases some of the instructions were being emitted redundantly to the minimum possible, while preserving the same output.
|
Looks good to me but I'll wait if @karwa has any suggestions... |
Hmm... I'm not sure if we should just silently return without drawing anything if the number of points are invalid. It might be worth making these in to In general it's not a good idea to silently return without doing anything - they can be difficult to debug or mask other errors. We told the renderer to draw, so it should draw (or fail loudly, telling me why it couldn't draw).
Thanks very much for tracking this down! This looks much better! 😍
OK, so there are 2 parts to this: the bar/marker alignment, and aliasing. The first is an accuracy issue, and the latter is the an image quality issue. As for the first part: it's definitely worth fixing, so thanks! 🙂 However, rather than removing the rounding, have you tried making the markers round in the same way as the bars? In general, we would like to round to integer coordinates, which leads me on the second issue. Personally, I would prefer that we deferred tackling the aliasing issue until after GCI. This is an issue which affects basically everything that we draw, and there are several things to consider for a complete solution. It's not enough to just collapse everything in to a polygon and not use rectangles ever - sometimes we need to draw individual rectangles, and we need them to be sharp whenever we do it. But aliasing sucks - for many plots, it totally ruins the output. So we should try to avoid it by rounding to integer coordinates and sizes whenever possible. (Also, we always want to round down - there's no point drawing 2 pixels/bar if you don't even have that much space). The only time when it isn't possible to round is when you're plotting a huge amount of data in a very small plot, so each element gets less than 1 pixel to display in. This leads to another issue - let's say I have 800 bars and a plot width of 900 pixels. Rounding would give us 1 pixel/bar, with a massive 100 pixels (11% of the plot width) completely empty. And it gets worse - if you increased the plot width to 1500 pixels, the data would still only occupy 800 pixels, and we'd need to figure out what to do with the remaining 700 (47% of the plot). There are 2 options for how to use that space:
So to summarise, there are 3 ways to lay out the plot:
We should give the user control over which mode they prefer. We might also have some kind of adaptive option which resolves to one of those 3 based on some inspection of the data and image size. But again, this affects every plot, and is a sufficiently large issue that I think we should wait until after GCI. For now I think we should continue to use rectangles for the histogram's
Cool, sounds good 👍 |
I agree and will change it to a precondition with a helpful message. The reason I had changed it to bail out was because the algorithms assumed they could ask to draw without enough points as a way to reduce the complexity of the rules, but honestly it doesn't make much of a difference to the rules now that I am checking them and there were not many cases where the algorithm did this.
No, I have not tried that, I started thinking that that would lead to us having to adjust everything else as you say afterwards so I though this would be the better option. But the way it is now the grid lines and the markers will almost never be crisp nor will the bar edges, so what you say makes sense.
Should I then leave the So these are the changes I will make for now:
|
|
Apparently I already did step 2:
and forgot that it also implied not being possible to ask to draw lines with less than 2 points. |
…wift test --generate-linuxmain`.
|
Ok, finished with the changes for now. Thank you for your time reviewing! |
|
@karwa, I was thinking about this aside you talked about:
And thought that maybe you were referring to my use of
Blue: foreground series. As you can see it only rounds up or down the correct points, that will be hidden behind the series in the foreground, while keeping the visible width of both series the exact same. Now that I think more about this, you said the following:
I was thinking that maybe the first option could be handled by this algorithm with the benefit that there will be no aliasing effects visible (by this I mean the white lines, not that the edges will not be aliased). The other two options could be handled by using simple rects or this algorithm as the result would be the exact same, its just a question of rounding down the I wanted to clear up a little bit about what the algorithm does in case you tough it was working in another way and influencing your feedback. Once again thank you for taking the time to read this! |
|
Also I can answer any questions about how the algorithm works if it helps make a more informed decision. |
…ed to draw.

There is no change in the output.
This change is the same as the one made in PR KarthikRIyer#64.
|
@karwa I think you may have missed the last couple of comments in this PR, can I ask you to check them out when you're available? |
I was just referring to the sizing calculations. Both are required to really fix the aliasing issue, since it otherwise leads to an incorrect scale and unaligned offsets. I this this PR is fine, I don't have anything to add ✅ |
# Conflicts:
#	Sources/SVGRenderer/SVGRenderer.swift
#	Sources/SwiftPlot/Histogram.swift
#	Tests/SwiftPlotTests/Histogram/histogram-stacked-step.swift
#	Tests/SwiftPlotTests/Histogram/histogram-stacked.swift
#	Tests/SwiftPlotTests/Reference/agg/_21_histogram.png
#	Tests/SwiftPlotTests/Reference/agg/_22_histogram_step.png
#	Tests/SwiftPlotTests/XCTestManifests.swift
|
Ok, I have fixed the merge conflicts, but I was a bit out of the loop lately so I may have made some mistakes that do not manifest in the tests due to recent changes. It would be nice if someone could have a quick look at the If everything is alright then this can be merged! @KarthikRIyer @karwa |
|
This looks fine. Now that GCI is over I think this can be merged. |
* rfac: Change global constant `zeroPoint` into a static property on `Point` and adjust everywhere where it was being used.

* rfac: Change `drawSolidPolygon` to take a new struct `Polygon` instead of `[Point]`.

- This allows us to be sure that, in each renderer, there will always be at least 3 points, avoiding having to check for that in every renderer.
- This moves the problem of ensuring that there are always 3 points up the stack, making sure that the programmer ensures this as soon as possible by taking advantage of the type system, while letting the rest of the code not worry about this.

* rfac: Reorder init.

* docs: Fix documentation for `drawSolidPolygon`

* bfix: Change `drawPlotLines` to draw a single polyline.

* rfac: Don't be clever with iterators.

* Add a failable initializer taking an array of points which returns `nil` if `points` doesn't have enough points.

* rfac: Improve rules of `.step` so no lines with 0 or 1 points are asked to draw.

There is no change in the output.
This change is the same as the one made in PR #64.

* rfac: `drawPlotLines` now takes a new struct `Polyline` instead of an array of points.

This has the same advantage as the `Polygon` of making the user handle the fact that it needs at least 3 points, as early as possible and preserving that fact in the type itself.

* chor: Rename `drawPlotLines` to `drawPolyline`

* Change Polyline and Polygon to internally use just an array with a precondition on the `didSet` one single failable initializer.

* Make requested changes and corrections from review

- Correct precondition check
- Remove label from `drawSolidPolygon`
- Make a variadic version of the initialiser for `Polyline` and `Polygon`
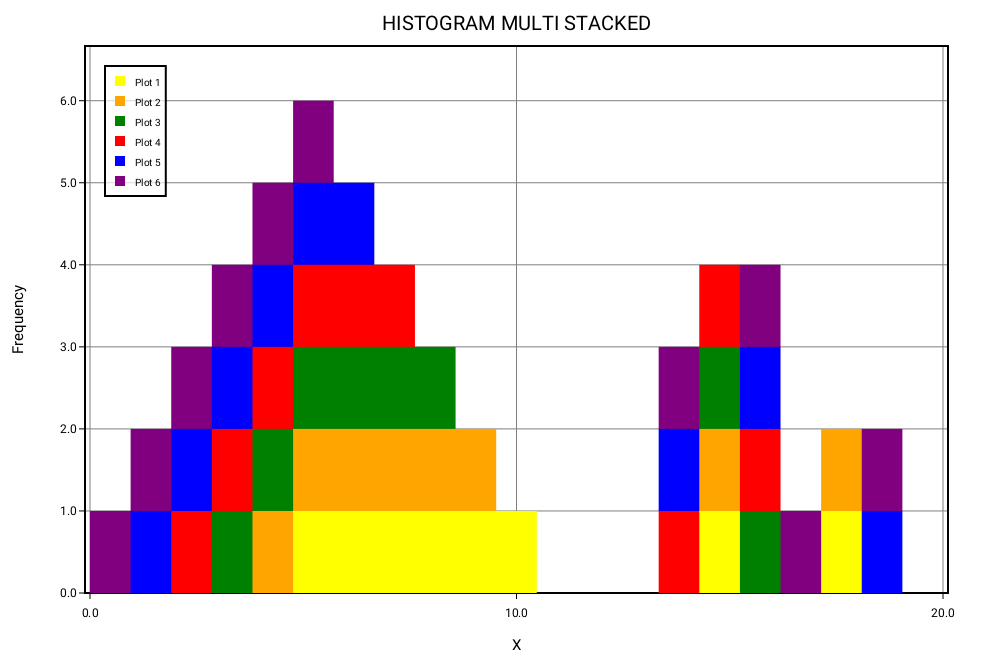
drawSolidPolygonanddrawPlotLinesfor each renderer now checks for the number of points passed in before doing any drawing.barWidthwhich in histograms with a lot of bins could lead to significant offsets for each bar relative to the x markers. Removing this rounding introduces another bug though: introduction of white lines of variable width in between the bars due to antialiasing and painter's algorithm used by some renderers.drawDataand fix white lines by naïvely drawing polygons with all of the points of each series, the series being drawn on top of each other, with most of the surface being redrawn each time. This leads the colours from series in the back to mix with the colours of series overlaid on top, at the edges of bars..barthat "tucks" the series on the back slightly behind the ones in front, byflooring orceiling the points coordinates at the right places. This fixes white lines between different series and the colour of background series bleeding through the edges of foreground series..stepby removing one "instruction" and reducing the times other instructions were being issued to the bare minimum without modifying the output files.Difference between before and after fixing the rounded
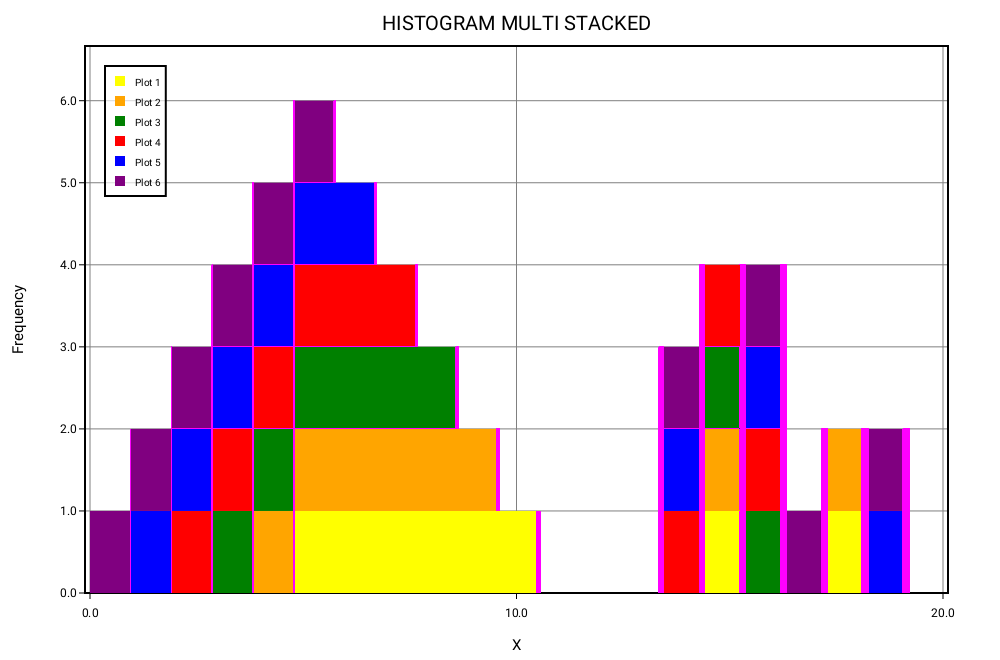
barWidthand the rest:The difference between the before and after fixing the colour bleeding can be seen here (its easier to see on the right side where there are lots of different series of different colours side by side):