
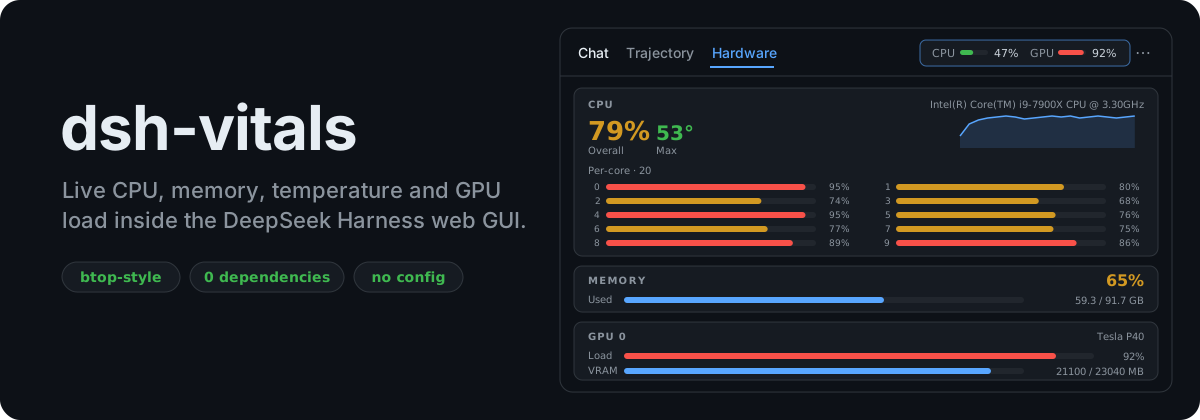






A DeepSeek Harness (dsh) web GUI plugin that shows live hardware load right where you work: a self-contained, dependency-free companion to btop. Watch your GPU while your local model thinks, without leaving the chat.
npx @deepseek-ai/dsh plugin --profile web add dsh-vitalsNo restart needed (the web profile reloads live). Reload the browser tab: CPU and GPU load appear in the session header, and the full Hardware tab sits next to Chat / Trajectory. Full details under Install.

The mini widget in the session header: always visible while you chat. Click it to jump to the full Hardware tab.
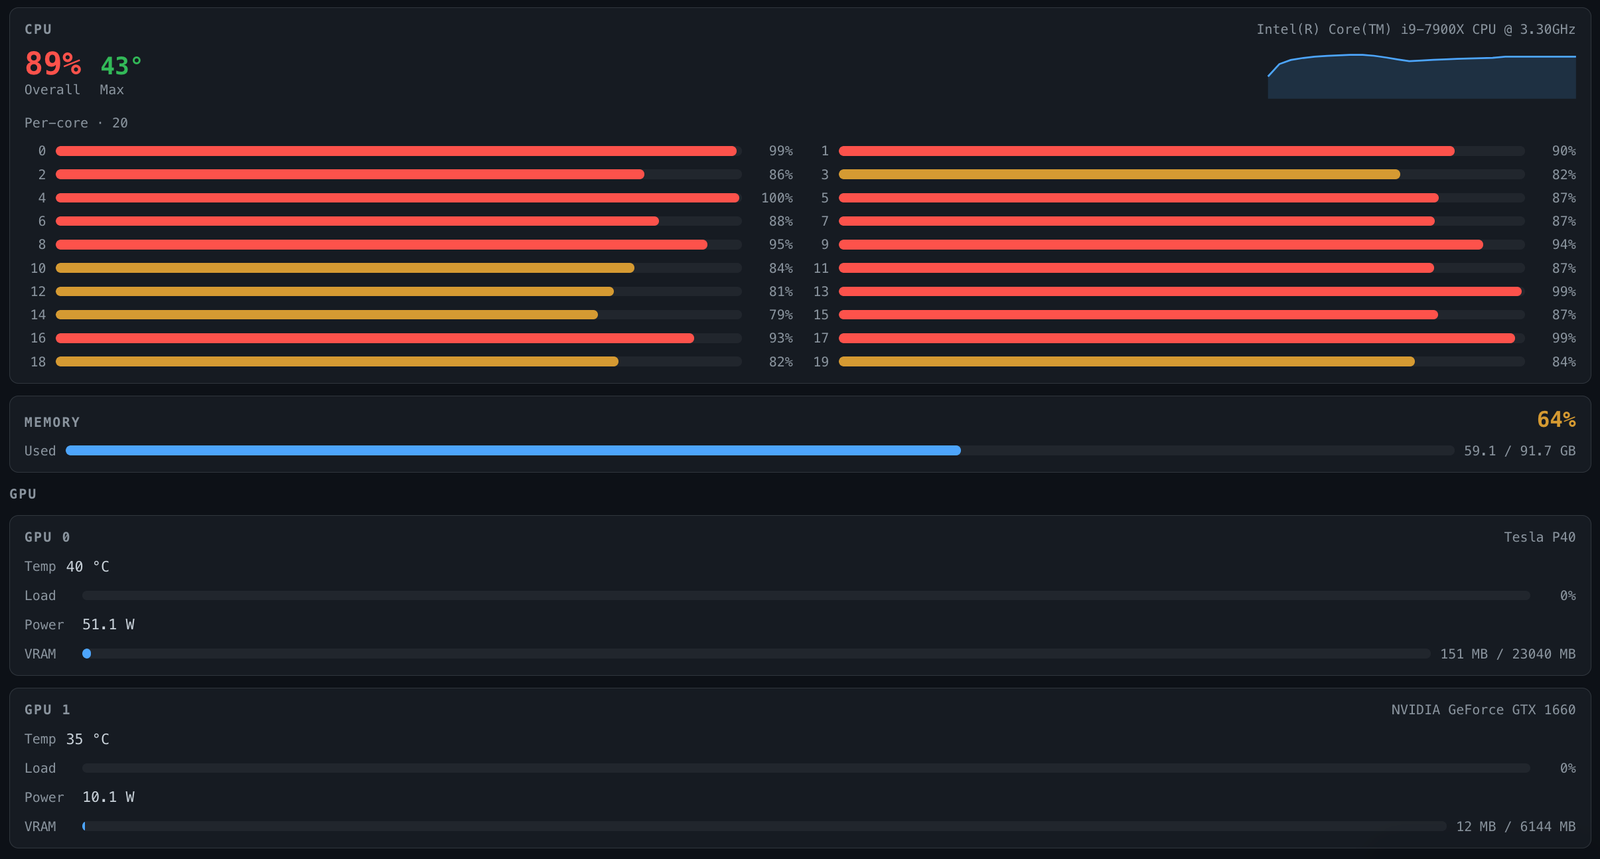
- CPU — overall utilisation, a live 60s sparkline, highest temperature reading, and per-core load (every physical core, any count) — with per-thermal-zone detail when there's more than one sensor
- Memory — used / available / total with utilisation %
- GPUs — one card each: name, temperature, utilisation, power draw, and VRAM (used / total)
Data is sampled host-side on every poll (~0.5 s) and rendered live.
- Host — a
GET-only route registered on the dsh web server (/plugins/dsh-vitals/data) that reads the OS's own sources with no privileged access and returns JSON. - Client — a single self-contained bundle that polls the route and draws the panels with inline styles (no CSS pipeline, no assets).
Two access points, both live the moment the plugin is bundled — no setup:
- A mini widget in the session header, next to the "⋯" menu: CPU and per-GPU load as tiny bars, always visible while you chat. Hover for temps and VRAM; click to jump to the full tab.
- A full
Hardwaretab next to Chat / Trajectory at the top of the conversation view: per-core CPU, memory, temperatures and every GPU.
Linux, macOS and Windows. Each signal uses the best unprivileged source the OS
offers and hides itself when there is none. Linux is tested live; the macOS and
Windows readers are only checked against sample output (npm test) so far.
Reports from real Macs and Windows machines are very welcome.
| Signal | Linux | macOS | Windows |
|---|---|---|---|
| CPU load (overall + per core) | /proc/stat |
os.cpus() |
os.cpus() |
| Memory | /proc/meminfo |
vm_stat (counts cache as available, like Activity Monitor) |
os.freemem() |
| CPU temperature | /sys/class/thermal |
hidden (needs root) | WMI thermal zones, when the board exposes them (often needs dsh running as admin) |
| NVIDIA GPUs | nvidia-smi |
nvidia-smi |
nvidia-smi.exe (PATH or NVSMI folder) |
| Apple / other GPUs | — | ioreg utilisation + memory in use |
— |
Everything degrades gracefully: a missing source hides that panel or shows a placeholder instead of breaking the tab. Any number of GPUs and any CPU core count is supported.
Into your dsh web profile (web below is the profile name; use whichever
profile backs your web GUI). From a source checkout, use pnpm dsh instead of
npx @deepseek-ai/dsh:
npx @deepseek-ai/dsh plugin --profile web add dsh-vitalsThis installs the package into the profile and adds it to
dsh.profile.bundles for you — no manual package.json editing. (No local
dsh binary? Run the equivalent by hand from the profile directory, e.g.
~/.dsh/profiles/web/: pnpm add dsh-vitals, then add "dsh-vitals" to
that package.json's dsh.profile.bundles array yourself.)
The published package ships its built lib/ output, so no build step runs
on install.
No restart: the shipped web profile reloads live, so the plugin shows up under
Plugins right away. Reload the browser tab — see
Where it shows up above for how to find it.
Requires Node 20+. Dependencies are dev-only (esbuild); the published package has zero runtime npm dependencies.
git clone https://github.com/JoblessJoe/dsh-vitals.git
cd dsh-vitals
pnpm install
node scripts/build.mjs     # emits lib/index.js + lib/client.js
package.json declares a build script, so pnpm build works too.
None. The plugin reads whatever the host exposes; there is no config surface.
The data route sits outside the dsh web server's /api trust fence, so it
enforces that fence itself: Sec-Fetch-Site: cross-site requests are rejected
(403) and only GET/HEAD are served (405 otherwise). All sources are read-only.
MIT
中文简介 · DeepSeek Harness (dsh) Web 界面插件:像 btop 一样实时显示硬件负载,无需离开聊天。会话标题栏有迷你小组件,Chat / Trajectory 旁边有完整的 Hardware 标签页:CPU 总负载和每核负载、内存、温度,以及每块 GPU 的温度、负载、功耗和显存。支持 Linux、macOS、Windows,零运行时依赖,无需配置。
安装:npx @deepseek-ai/dsh plugin --profile web add dsh-vitals(web 配置实时加载,无需重启)