

English | 简体中文
npm i @vanyi/kline
-
Browser:
<link rel="stylesheet" href="path/to/kline.min.css"><script src="path/to/kline.min.js"></script>Module:
import VyKline from '@vanyi/kline';import '@vanyi/kline/lib/kline.min.css;' -
After dom is loaded, run
VyKline.bootstrap(options),option: Object; -
options:containerChart mount pointtype: HTMLElement;deedfeedsData feedback objecttype: Object,See below for detailed configuration;defaultIntervalDefault time granularitytype: String,See below for detailed configuration;intervalTime granularity collectiontype: Array,defaultInterval's collection;themethemetype: String, Optionallight | dark, default:light;customChartCustom chart configurationtype: Object,See below for detailed configuration;customLoadingElCustom loading nodetype: HTMLElement, Optional,The style needs to be set to absolute positioning, width and height 100%;chartTypeChart typetype: String, OptionalKLINE | EMPTY_KLINE,defaultKLINE;showIntervalToolbarWhether to display the time granularity bartype: BooleanOptional,defaulttrue;langLanguagetype: String, OptionalzhCN | enUS, defaultzhCN;onTimeIntervalChangedThis event is triggered when the time granularity is switched,The parameter is time granularitytype: Function,Optional.
-
deedfeedsData feedback object,enter data for the chart.-
setHistoryData({ interval, setHistoryData, subscribeData })Set historical dataintervalCurrent time granularity
setHistoryDataCallback,Parameters are historical dataArray,Standard data objects are as follows:{ time: null, // 1590314400000 open: null, high: null, low: null, close: null, volume: null // Trading volume }getRealTimeDataCallback,Parameters are standard data objects,Same as above. -
intervalChanged({ interval, setHistoryData, subscribeData })Triggered when time granularity is switched,Note: Here you should unsubscribe before getting historical dataintervalCurrent time granularity
setHistoryDataCallback,Parameters are historical dataArray
subscribeDataCallback,The parameter is the current data objectObject
-
-
defaultIntervalDefault time granularity,format:'m1','h1', 'd1', 'w1', 'M1'Corresponding tominute, hour, day, week, month -
customChartChart custom configuration object:{ default_rise_color: '#53b987', // rise default_fall_color: '#eb4d5c', // fall init_offset_x: 100, // Initial chart offset volume_height: 100, // Trading volume height interval_tool_bar: '30px', // Time granularity bar default height }
switchChartTypeSwitch chart type,paramType: StringOptional value:KLINE|EMPTY_KLINEswitchThemeSwitch theme,paramType: StringOptional value:light|darkswitchLangSwitch language,paramType: StringOptional value:zhCN|enUS
Mainstream browser
MIT
Copyright (c) 2020 Vanyi0924
https://vanyi0924.github.io/kline/
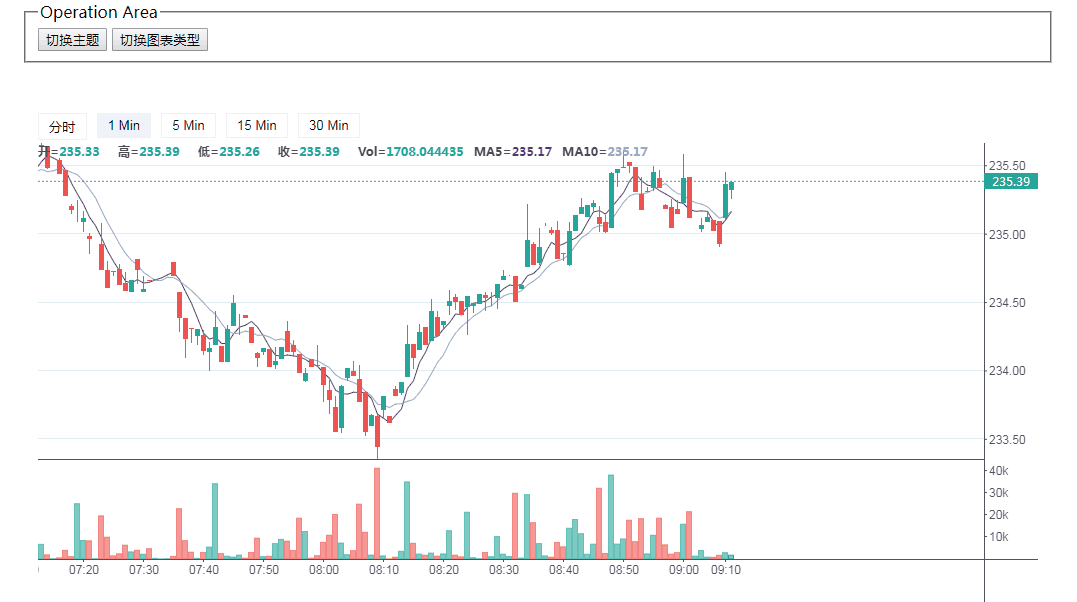
The chart is completely driven by data, and only focuses on the introduction of data, so as long as you access the data that meets the standards.The example uses the websocket way,Thankshuobifor the data interface provided.
This is a project developed and maintained by virtue of personal interests, hobbies and sense of responsibility,If it can bring you a little help,please star to let more people know it,Thank you!Community support is my motivation.(づ ̄3 ̄)づ╭❤~
- x,y axis optimization
- internationalization
- custom theme(If you need customization urgently, you can modify or add it in
/src/config/theme)