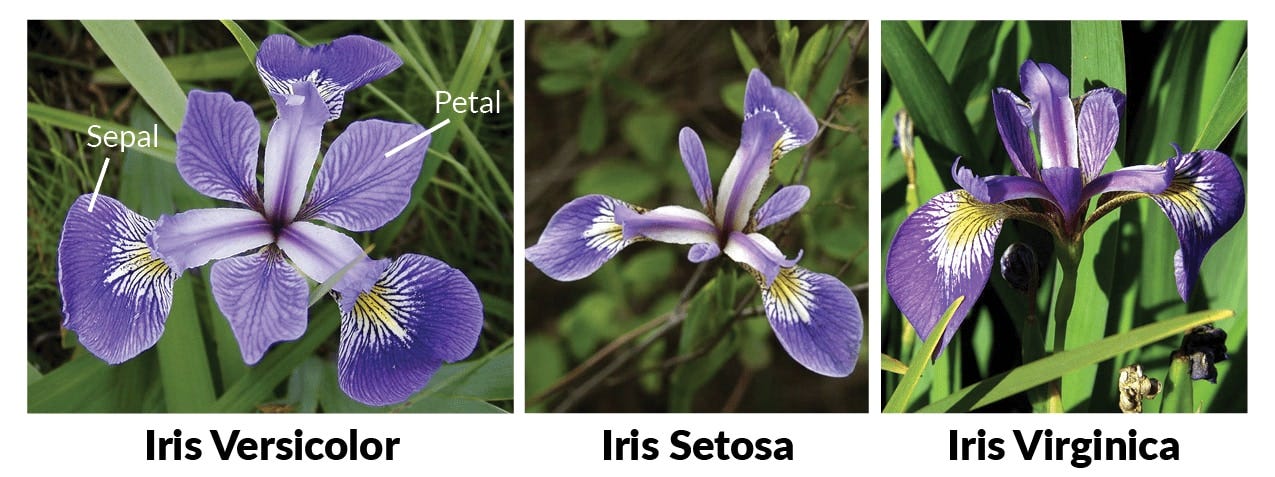
The Iris flower data set is a multivariate data set introduced by the British statistician and biologist Ronald Fishe.The use of multiple measurements in taxonomic problems. It is sometimes called Anderson's Iris data set because Edgar Anderson collected the data to quantify the morphologic variation of Iris flowers of three related species. The data set consists of 50 samples from each of three species of Iris (Iris Setosa, Iris virginica, and Iris versicolor). Four features were measured from each sample: the length and the width of the sepals and petals, in centimeters.
This dataset became a typical test case for many statistical classification techniques in machine learning such as support vector machines
The dataset contains a set of 150 records under 5 attributes - Petal Length, Petal Width,
Sepal Length, Sepal width and Class(Species).
The approach we use here revolves around fitcsvm function provided in Matlab. But the
problem lies in the fact that fitcsvm can only perform binary classification, whereas
we have three class classification here. To solve that problem, we use one to all
classification where we train two models, one to classify between Setosa and rest and
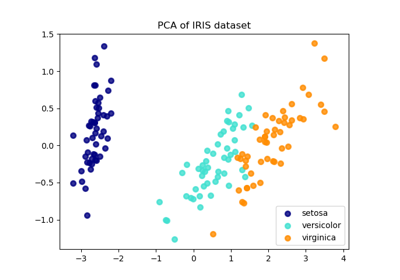
another between Virginica and Iris versicolor. Our approch of dividing first between setosa
and rest is justified by below given plot which show setosa can be easily separated from
rest as dataset have a sufficient gap.
accuracy.m - This function is to calculate the accuracy and arguments needed here are "predicted output" and "actual output." TrainTestSeparation.m - This function properly divide dataset into ratio r1:r2 provided as argument to the function. Proper division of dataset means each category have equal contribution to separation with proper shuffling. predict_values.m - Training and testing part take place here. iris.m - This is the main function where all the functions were combined to give a fruitful result.
This dataset is free and is publicly available at the UCI Machine Learning Repository.

