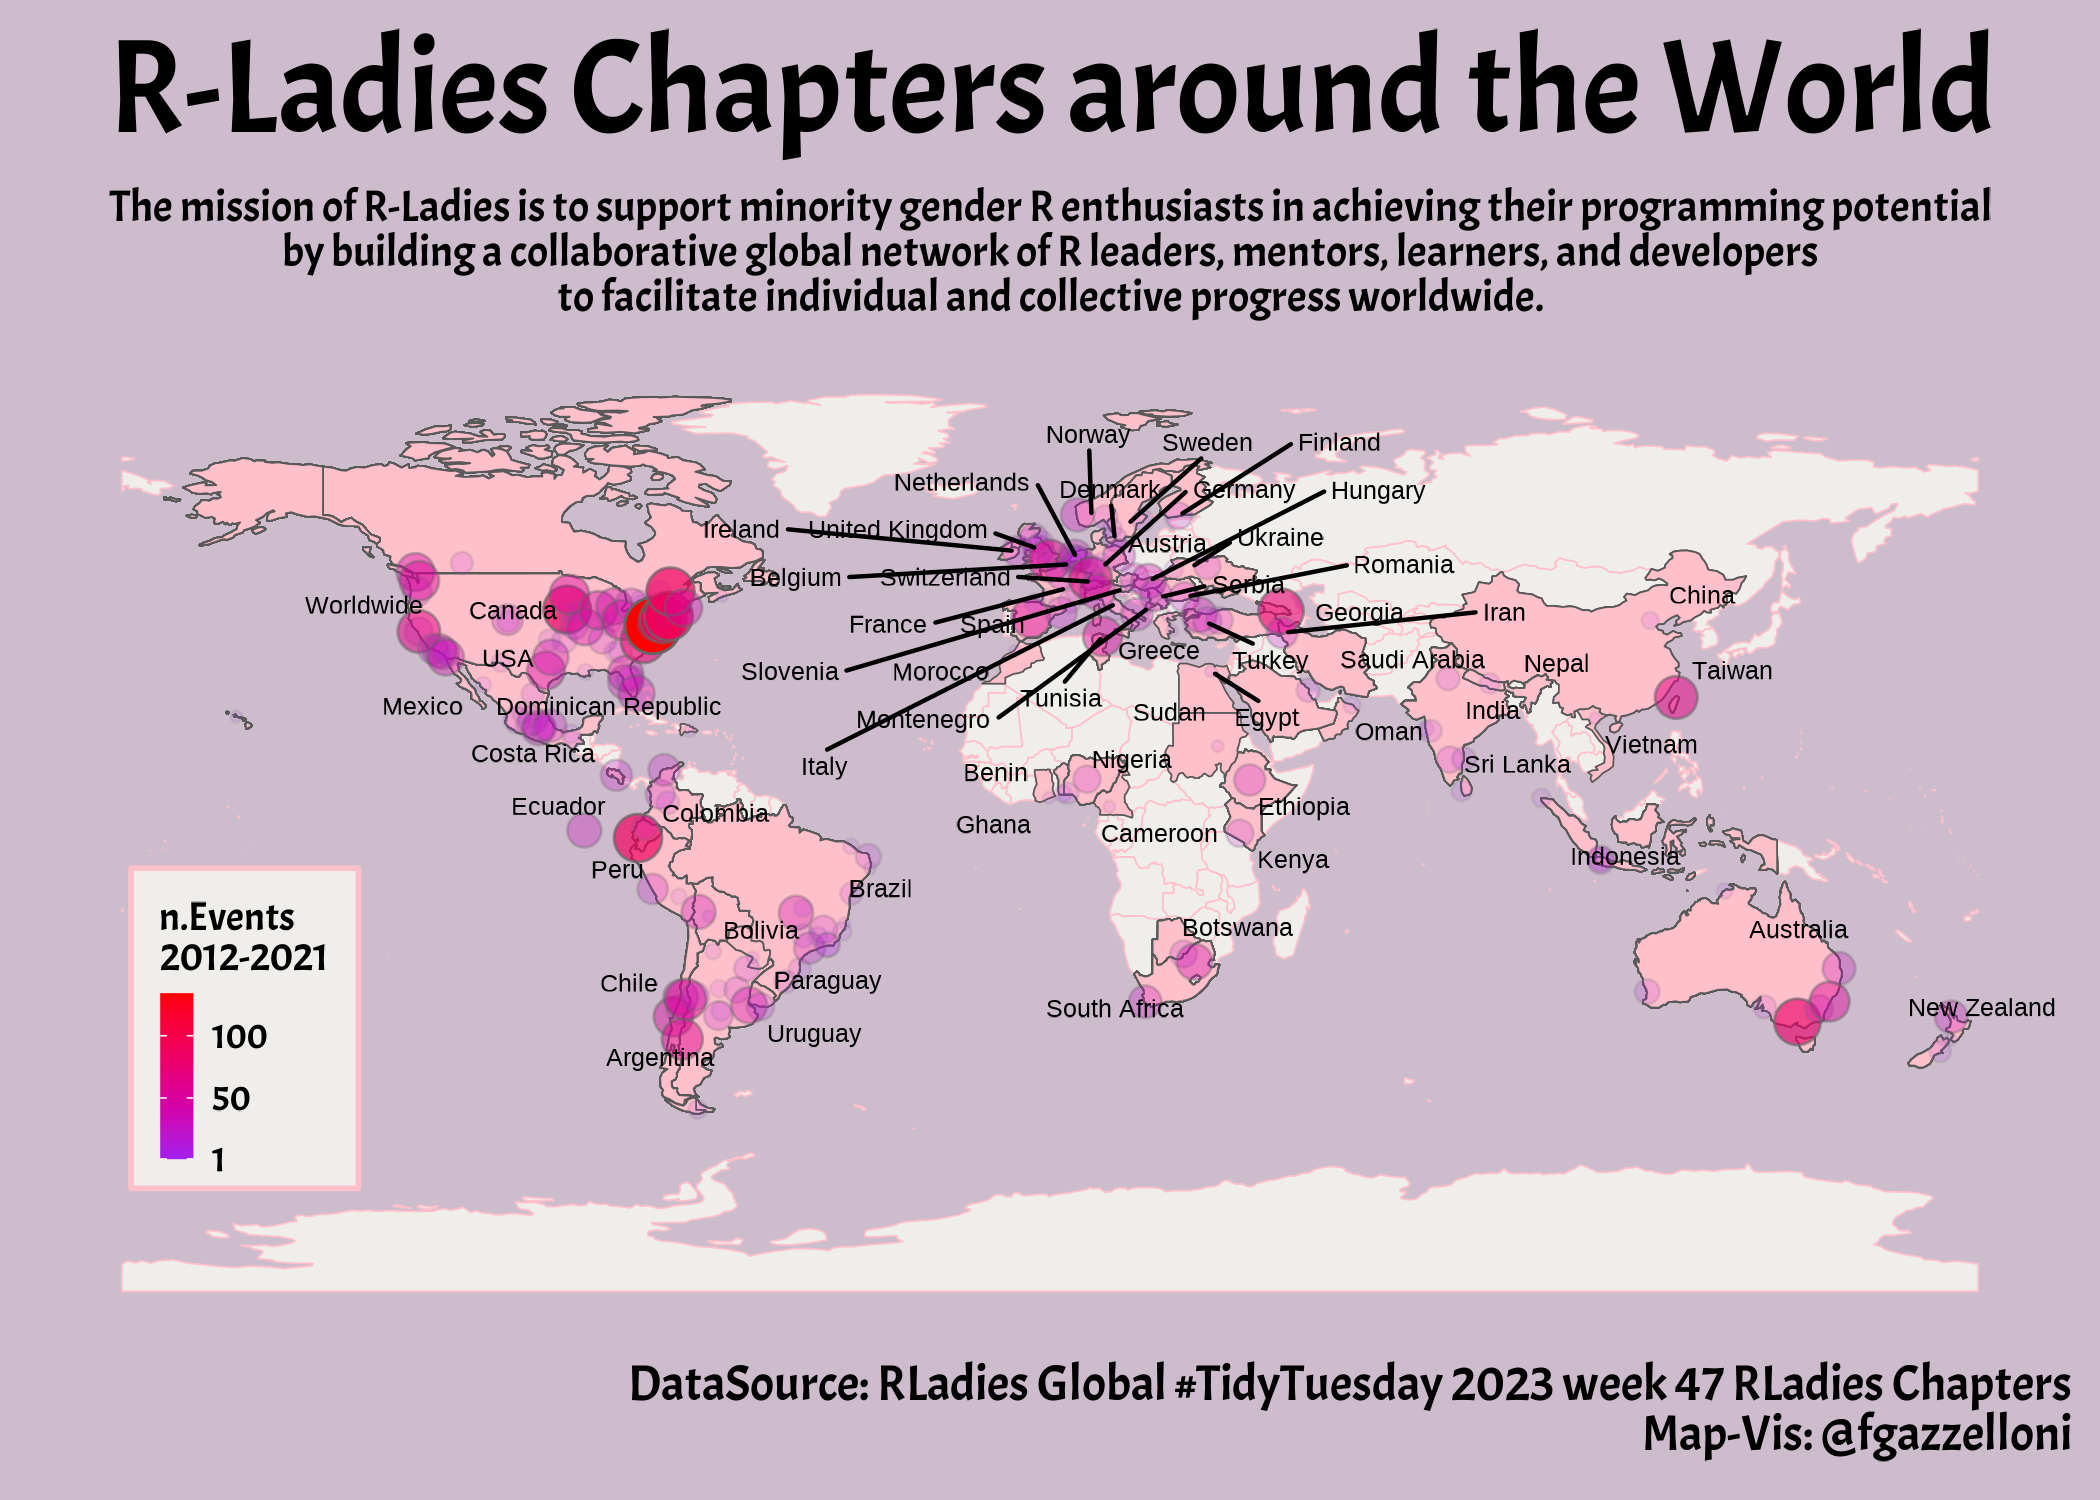
TidyTuesday project is a weekly appointment that happens on every Tuesday for practicing making #DataVisualization with datasets provided by the #R4DS Online Learning Community
Several TidyTuesday interesting examples can be found in the main repository:
Twitter @fgazzelloni and collected in this repository with related code.
| 30DayChartChallenge-2021 | 30DayMapChallenge-2021 |
| 30DayChartChallenge-2022 | 30DayMapChallenge-2022 |
| 30DayChartChallenge-2023 |
-
import data found in the README at the middle bottom of the page is a table with the most updated data provided for the year/week
-
click on the corresponding data tab in the table
-
load the data, two options are available:
-
Install {tidytuesdayR} package from CRAN via:
install.packages("tidytuesdayR"), then load the data as suggested assigning a tuesdata variable name using thett_load()function:tuesdata <- tidytuesdayR::tt_load("date")tuesdata <- tidytuesdayR::tt_load(year, week) -
Import the data directly from the .csv file provided
-


