Support for weewx DWD
---ENGLISH VERSION BELOW---
Der Skin bietet von Haus aus die Möglichkeit, die verschiedenen Daten die von weewx-DWD bereitgestellt werden, darzustellen.
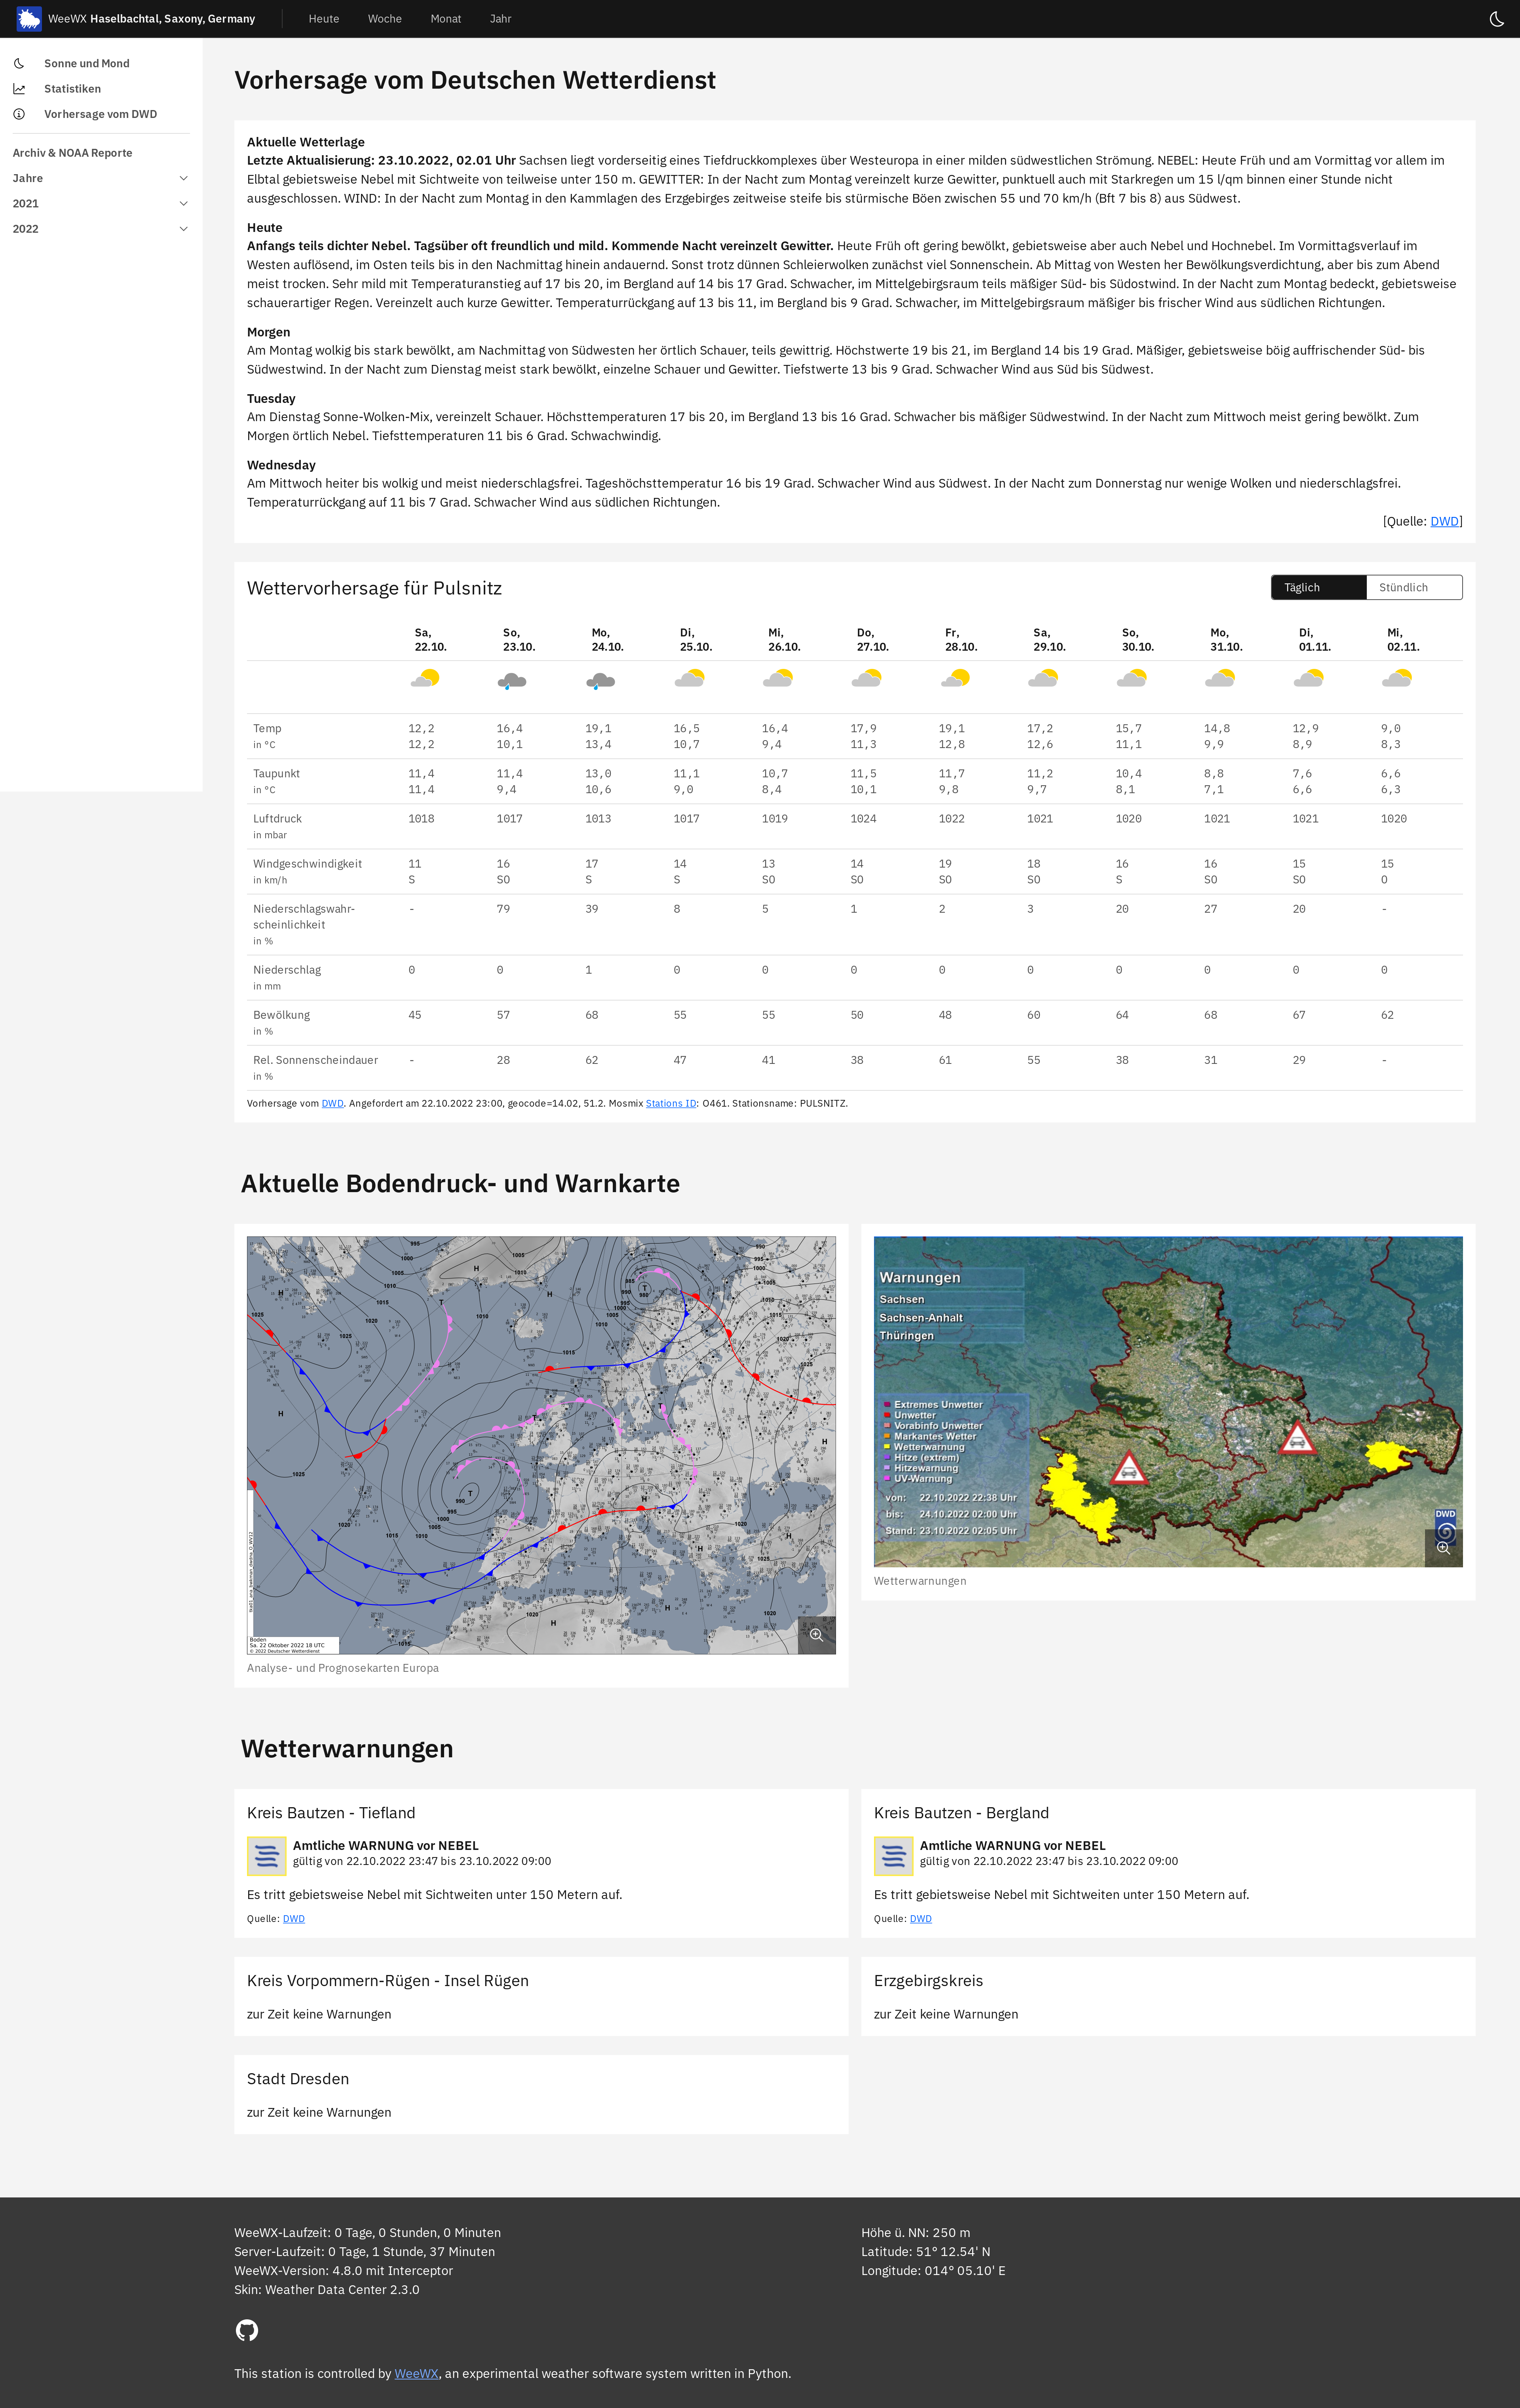 DWD-Seite im Skin
weewx-dwd muss so konfiguriert werden, das die generierten Daten im Verzeichnis des skins im Order dwd abgelegt werden. Das ist entweder unter /etc/weewx/skins/weewx-wdc/dwd oder unter /home/weewx/skins/weewx-wdc/dwd. Siehe https://www.weewx.com/docs/usersguide.htm#Where_to_find_things und https://github.com/roe-dl/weewx-DWD#verzeichnis-anlegen.
Ich benutze WeeWX im Docker Container, eine Beispiel Einrichtung für weewx-dwd ist hier zu finden: https://github.com/Daveiano/weewx-wdc-interceptor-docker/tree/weewx-dwd
Als Icons für die Wettervorhersage können entweder die Icons vom DWD genutzt werden (siehe https://www.dwd.de/DE/wetter/warnungen_aktuell/objekt_einbindung/piktogramm_node.html unter 'Icons - Wetterzustände', download 'wettericons.zip') oder Icons vom IBM Carbon Design System, der Download ist hier verfügbar.
Die Icons müssen heruntergeladen und im web Verzeichnis unter dwd/icons/ platziert werden also z.b. unter /var/www/html/weewx/dwd/icons/.
Siehe hierfür auch https://github.com/roe-dl/weewx-DWD#konfiguration-in-weewxconf. Die Einstellung icons sollte auf den selben Pfad zeigen: icons='../dwd/icons'.
Die Konfiguration icon_set wird derzeit nicht untersützt und muss auf dwd gesetzt sein: icon_set=dwd

DWD Icons

IBM Carbon Icons
Auch die Warnicons müssen vom DWD heruntergeladen werden (https://www.dwd.de/DE/wetter/warnungen_aktuell/objekt_einbindung/piktogramm_node.html unter Icons - Warnelement, warnicons_nach_stufen_50x50.zip) und in das Web Verzeichnis z.b. unter dwd/warn_icons platziert werden. Der Pfad muss mit der Konfiguration in der weewx.conf unter [DeutscherWetterdienst] [[warning]] icons übereinstimmen:
[DeutscherWetterdienst]
    [[warning]]
        icons='../dwd/warn_icons'
Standardmäßig werden die Icons vom DWD benutzt, wenn die Carbon Icons genutzt werden sollen, muss dies in den dwd forecast_table_settings aktiviert werden:
[Extras]
    ...
    [[weewx-DWD]]
        ...
        [[[forecast_table_settings]]]
            ...
            carbon_icons = 1
Wenn dwd-mosmix verwendet wird, wird die Wettervorhersage sowohl auf der Startseite, als auch auf der DWD-Seite angezeigt. Auf der DWD-Seite können noch zusätzliche Daten angezeigt werden, wie z.B. Vorhersage in Textform, Wetterwarnungen oder Wetterkarten.
Um die DWD-Seite zu aktivieren, muss in der skin.conf der entsprechende Teil entkommentiert werden:
[CheetahGenerator]
    ...
    [[Static]]
        [[[DWD]]]
            template = dwd.html.tmpl
            title = Vorhersage vom DWD
Eine Beispielkonfiguration in der skin.conf mit allen möglichen Optionen:
[Extras]
    [[weewx-DWD]]
        show_text_forecast = True
        dwd_link = https://www.dwd.de/DE/wetter/wetterundklima_vorort/sachsen/sac_node.html
        text_forecast_VHDL = DWLG
        show_pressure_map = True
        show_warning_map = True
        warning_map_filename = 'SchilderLZ.jpg'
        show_text_warnings = True
        show_warnings_on_front=BBL
        show_forecast = True
        mosmix_id = O461
        [[[forecast_table_settings]]]
            show_hourly = 1
            # Does not make sense, do we need this in weewx-forecast?
            #show_legend = 1
            show_date = 1
            show_outlook = 1
            show_temp = 1
            show_dewpoint = 1
            show_pressure = 1
            show_wind= 1
            show_pop = 1
            show_precip = 1
            show_cloud_cover = 1
            show_sun_dur = 1
            carbon_icons = 0
Beispielhafte weewx.conf:
[DeutscherWetterdienst]
    path='/home/weewx/skins/weewx-wdc/dwd'
    [[warning]]
        icons='./dwd/warn_icons'
        states='Sachsen'
        [[[counties]]]
              'Kreis Bautzen - Tiefland'='BTL'
              'Kreis Bautzen - Bergland'='BBL'
        [[[cities]]]
              'Stadt Dresden'='DD'
    [[forecast]]
        icon_set=dwd
        icons='./dwd/icons'
        orientation=h,v
        show_obs_symbols = True # optional
        show_obs_description = False # optional
        show_placemark = True # optional
Lädt eine Vorhersage in Textform für ein konfiguriertes Bundesland herunter. Dazu Bodenluftdruckkarten und eine Karte mit Wetterwarnungen.
Folgende Konfigurationen sind relevant:
show_text_forecast Zeige die Vorhersage in Textform?
text_forecast_VHDL Der VHDL-Code des Bundeslandes für den die Text-Vorhersage gezeigt werden soll, siehe https://github.com/roe-dl/weewx-DWD/wiki/Abk%C3%BCrzungen-der-Bundesl%C3%A4nder-beim-Deutschen-Wetterdienst (der Standardwert ist für Sachsen)
dwd_link Wird als "Quellen-Link" unter der Text-Vorhersage gezeigt (der Standardwert ist für Sachsen)
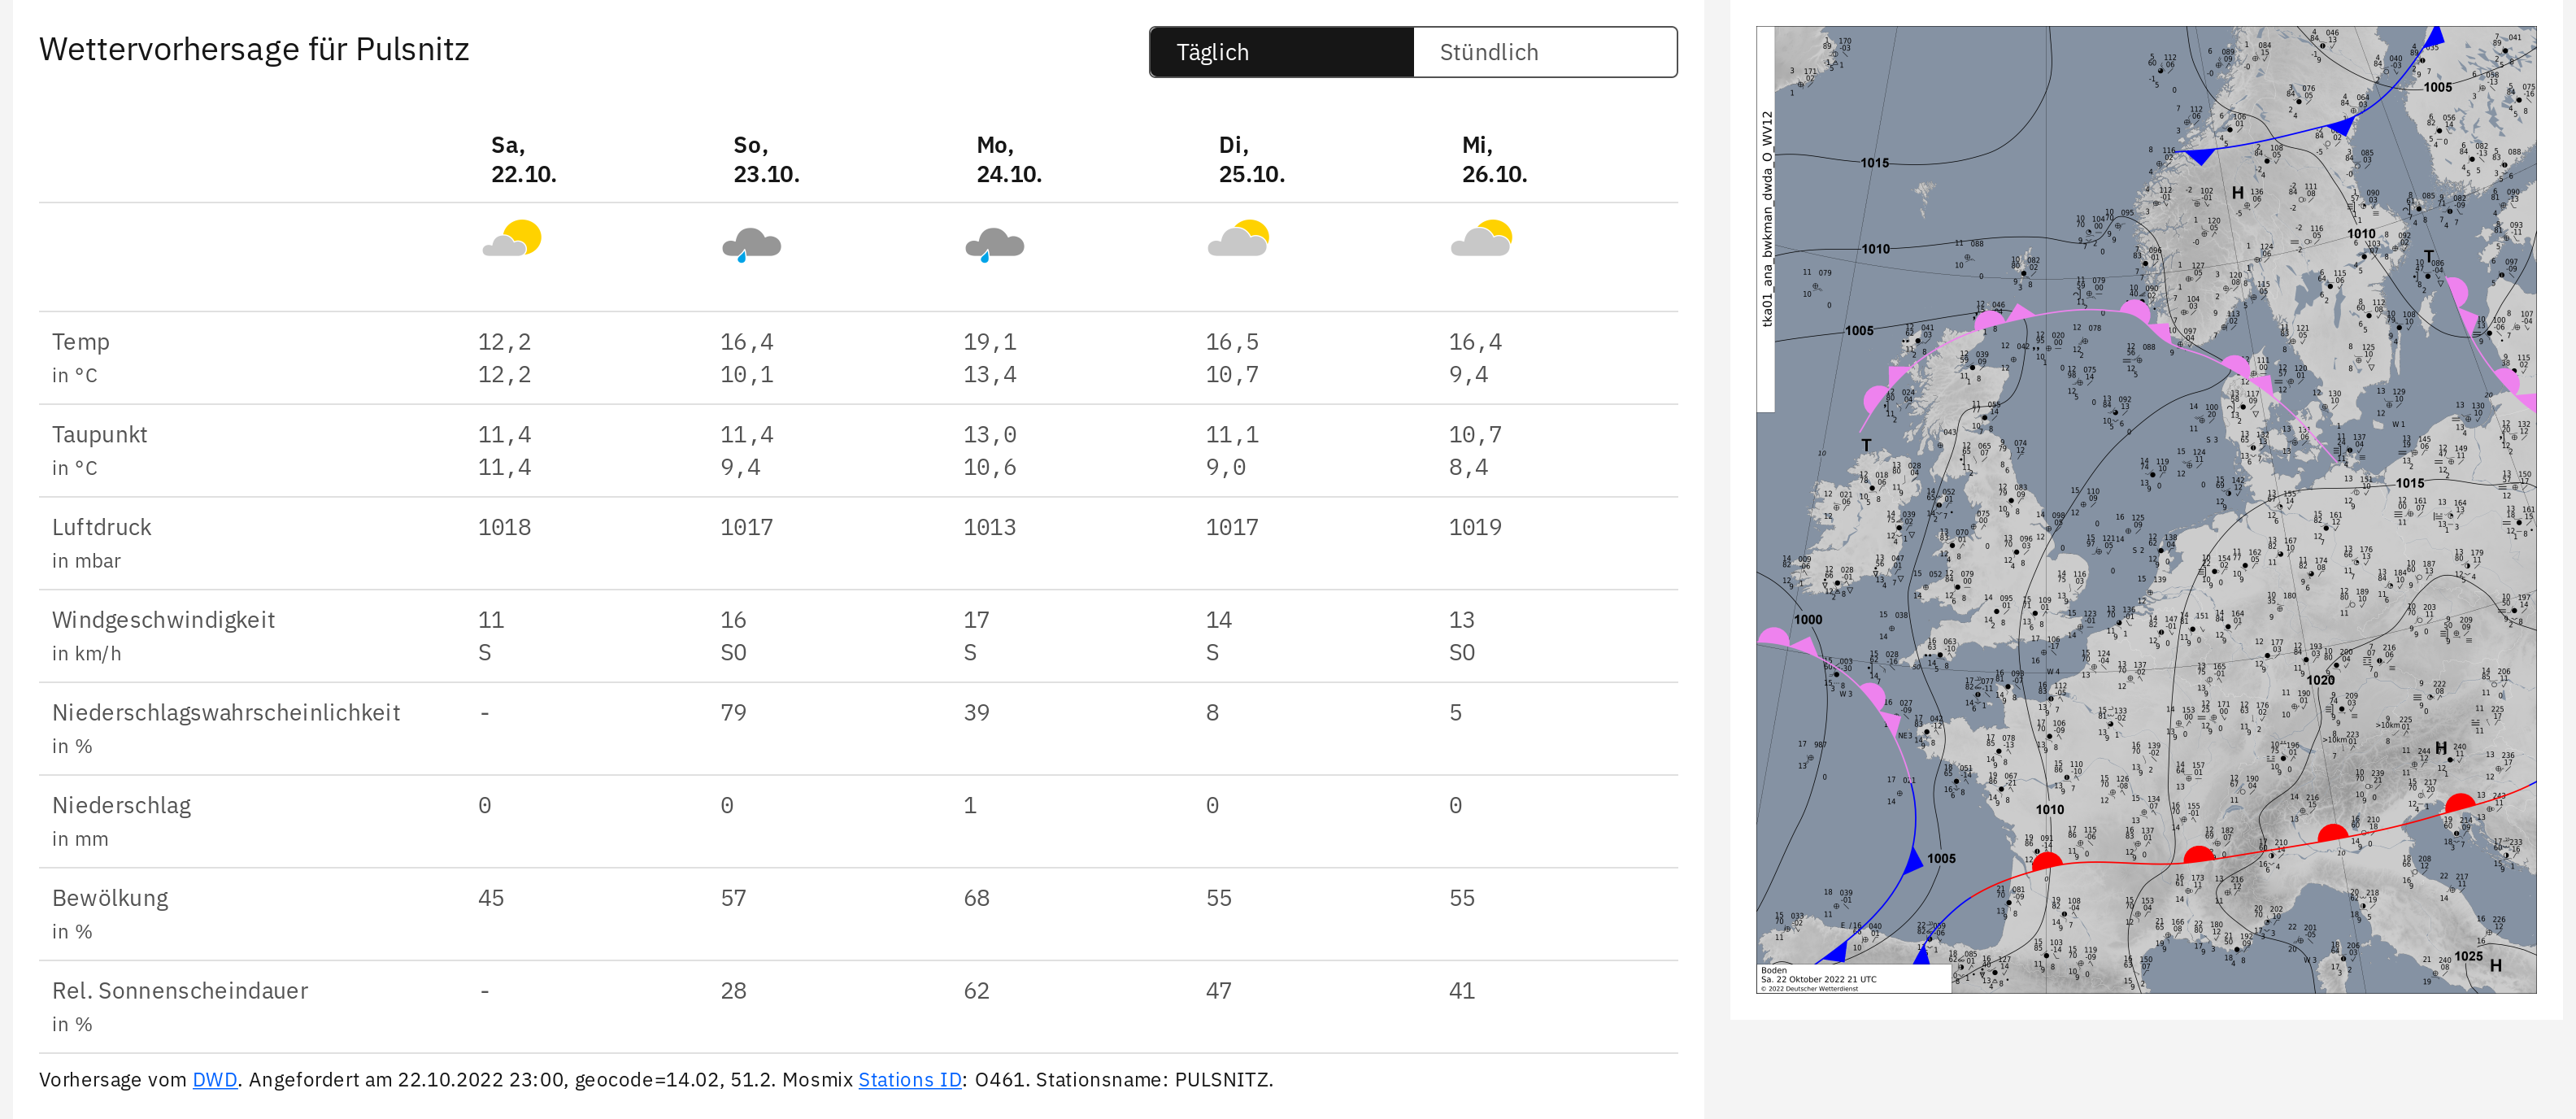
show_pressure_map Zeige die Bodenluftdruckkarte für West- und Mitteleuropa/Nordatlanktik (https://www.dwd.de/DWD/wetter/wv_spez/hobbymet/wetterkarten/bwk_bodendruck_weu_ana.png)
show_warning_map Zeige eine Karte mit Wetterwarnungen für das gewählte Bundesland, welches in der weewx.conf festgelegt werden muss, siehe https://github.com/roe-dl/weewx-DWD#konfiguration-in-weewxconf.
Achtung: Wenn die Bodenluftdruckkarte oder die Warnkarte verwendet wird, muss diese zusätzlich in der skin.conf angeben werden:
[CopyGenerator]
    copy_always = dwd/SchilderLZ.jpg, dwd/bwk_bodendruck_weu_ana.png, dwd/bwk_bodendruck_na_ana.png
Zeigt Warnungen für Landkreise/Städte.
Folgende Konfigurationen sind relevant:
show_text_warnings Zeige Warnungen in Textform für die festgelegten Landkreise und Städte. Diese müssen in der weewx.conf eingetragen werden, siehe https://github.com/roe-dl/weewx-DWD#konfiguration-in-weewxconf.
show_warnings_on_front Zeigt die Warnungen für die gewählte Region auf der Startseite (z.B. show_warnings_on_front=BBL)
warning_map_filename Dateiname der Warnkarte. Die Links für die verschiedenen Regionen können hier gefunden werden: https://www.dwd.de/DE/wetter/warnungen_aktuell/objekt_einbindung/objekteinbindung_node.html#doc582840bodyText6. Welche Warnkarte von weewx-DWD heruntergeladen wird, muss in wget-dwd gesetzt werden.
Tägliche / Stündliche Vorhersage via DWD-Mosmix.
Folgende Konfigurationen sind relevant:
show_forecast Zeige Vorhersage - gilt für die Startseite und für die DWD-Seite. Falls auch weewx-forecast aktiviert ist, wird anstelle die Vorhersage von weewx-DWD benutzt.
mosmix_id Mosmix Stations ID, siehe https://www.dwd.de/DE/leistungen/met_verfahren_mosmix/mosmix_stationskatalog.cfg?view=nasPublication&nn=16102. Muss außerdem in der weewx.conf gesetzt werden, siehe https://github.com/roe-dl/weewx-DWD#konfiguration-in-weewxconf.
dwd-mosmix als Diagramm
dwd-mosmix kann die Daten zusätzlich als sqlite Datenbak speichern. Diese Datenbank kann dann von weewx-wdc genutzt werden, um die Daten als Diagramm darzustellen. Die Einrichtung ist hier beschrieben: https://github.com/roe-dl/weewx-DWD#wettervorhersage-als-diagramm
Im skin sind "Plätze" für bis zu 3 Diagramme auf der DWD Seite reserviert, die in der skin.conf konfiguriert werden können, eine Beispielkonfiguration mit 3 Diagrammen könnte so aussehen:
...
[DisplayOptions]
    ...
    [[diagrams]]
        [[[combined_observations]]]
            # @see https://github.com/roe-dl/weewx-DWD#wettervorhersage-als-diagramm
            [[[[dwd_meteogram_1]]]]
                data_binding = dwd_binding
                label = Sunshine / Temperature / Dewpoint
                bottom_date_time_format = "%m/%d"
                tooltip_date_time_format = "%x %X"
                [[[[[obs]]]]]
                    [[[[[[sunshineDur]]]]]]
                       unit = minute
                       color = "#E3963E"
                       color_dark = "#E3963E"
                       observation = "sunshineDur"
                       enableArea = True
                       areaOpacity = 0.5
                    [[[[[[outTemp]]]]]]
                        observation = "outTemp"
                        color_dark = "#8B0000"
                    [[[[[[dewpoint]]]]]]
                        observation = "dewpoint"

            [[[[dwd_meteogram_2]]]]
                data_binding = dwd_binding
                label = POP / Rain / Cloud cover
                bottom_date_time_format = "%m/%d"
                tooltip_date_time_format = "%x %X"
                [[[[[obs]]]]]
                    [[[[[[rain]]]]]]
                       observation = "rain"
                    [[[[[[pop]]]]]]
                        observation = "pop"
                        color = "lightblue"
                        color_dark = "lightblue"
                    [[[[[[cloudcover]]]]]]
                        observation = "cloudcover"
                        color = "darkgrey"
                        color_dark = "lightgrey"

            [[[[dwd_meteogram_3]]]]
                data_binding = dwd_binding
                label = Wind speed / Gust speed
                bottom_date_time_format = "%m/%d"
                tooltip_date_time_format = "%x %X"
                areaOpacity = 0.5
                enableArea = True
                [[[[[obs]]]]]
                    [[[[[[windGust]]]]]]
                        observation = "windGust"
                    [[[[[[windSpeed]]]]]]
                        observation = "windSpeed"
Die Keys unter [[[combined_observations]]] müssen dwd_meteogram_1, dwd_meteogram_2 und dwd_meteogram_3 lauten, damit die Diagramme auf der DWD Seite angezeigt werden. Die Verfügbaren Observations sind hier zu finden: https://github.com/roe-dl/weewx-DWD#wettervorhersage-als-diagramm
Die verschiedenen, von weewx-DWD zur Verfügung gestellten Wetterkarten (bwk_bodendruck_na_ana.png, SchilderLZ.jpg, bwk_bodendruck_weu_ana.png) können auch als radar_img auf der Startseite gezeigt werden.
radar_html = <img src="dwd/SchilderLZ.jpg" alt="Radar" loading="lazy" /></a> (wenn die Karten im Web Verzeichnis im Ordner dwd liegen).
Wenn die Karten verwendet werden, müssen sie in die skin.conf eingetragen werden:
[CopyGenerator]
    copy_always = dwd/bwk_bodendruck_na_ana.png, dwd/SchilderLZ.jpg, dwd/bwk_bodendruck_weu_ana.png
TODO: Replace image with image with new dwd meteogram
Vorhersage auf der Startseite
---ENGLISH VERSION---
The skin provides the possibility to display the different data provided by weewx-DWD.
DWD Page
weewx-dwd must be configured to store the generated data in the skin directory in the dwd folder. This is either at /etc/weewx/skins/weewx-wdc/dwd or at /home/weewx/skins/weewx-wdc/dwd. See https://www.weewx.com/docs/usersguide.htm#Where_to_find_things and https://github.com/roe-dl/weewx-DWD#verzeichnis-anlegen.
Iam using WeeWX in a docker container, an example setup for weewx-dwd can be found here: https://github.com/Daveiano/weewx-wdc-interceptor-docker/tree/weewx-dwd
As icons for the weather forecast either the icons from the DWD can be used (see https://www.dwd.de/DE/wetter/warnungen_aktuell/objekt_einbindung/piktogramm_node.html under 'Icons - Wetterzustände', download 'wettericons.zip') or icons from the IBM Carbon Design System, the download is here available.
The icons must be downloaded and placed in the web directory at dwd/icons/, e.g. at /var/www/html/weewx/dwd/icons/.
See also https://github.com/roe-dl/weewx-DWD#konfiguration-in-weewxconf. The setting icons should point to the same path: icons='../dwd/icons'.
The configuration icon_set is currently not supported and must be set to dwd: icon_set=dwd
DWD Icons
IBM Carbon Icons
Also the warning icons must be downloaded from the DWD (https://www.dwd.de/DE/wetter/warnungen_aktuell/objekt_einbindung/piktogramm_node.html at Icons - Warnelement, warnicons_nach_stufen_50x50.zip) and placed in the web directory e.g. at dwd/warn_icons. The path must match the configuration in the weewx.conf under [DeutscherWetterdienst] [[warning]] icons:
[DeutscherWetterdienst]
    [[warning]]
        icons='../dwd/warn_icons'
By default the icons from the DWD are used, if the Carbon icons should be used, this must be enabled in the dwd forecast_table_settings:
[Extras]
    ...
    [[weewx-DWD]]
        ...
        [[[forecast_table_settings]]]
            ...
            carbon_icons = 1
If dwd-mosmix is used, the weather forecast is displayed on the start page as well as on the DWD page. On the DWD page additional data can be displayed, e.g. forecast in text form, weather warnings or weather maps.
To activate the DWD page, the corresponding part must be uncommented in the skin.conf:
[CheetahGenerator]
    ...
    [[Static]]
        [[[DWD]]]
            template = dwd.html.tmpl
            title = Vorhersage vom DWD
An example configuration in the skin.conf with all possible options:
[Extras]
    [[weewx-DWD]]
        show_text_forecast = True
        dwd_link = https://www.dwd.de/DE/wetter/wetterundklima_vorort/sachsen/sac_node.html
        text_forecast_VHDL = DWLG
        show_pressure_map = True
        show_warning_map = True
        warning_map_filename = 'SchilderLZ.jpg'
        show_text_warnings = True
        show_warnings_on_front=BBL
        show_forecast = True
        mosmix_id = O461
        [[[forecast_table_settings]]]
            show_hourly = 1
            # Does not make sense, do we need this in weewx-forecast?
            #show_legend = 1
            show_date = 1
            show_outlook = 1
            show_temp = 1
            show_dewpoint = 1
            show_pressure = 1
            show_wind= 1
            show_pop = 1
            show_precip = 1
            show_cloud_cover = 1
            show_sun_dur = 1
            carbon_icons = 0
Example weewx.conf:
[DeutscherWetterdienst]
    path='/home/weewx/skins/weewx-wdc/dwd'
    [[warning]]
        icons='./dwd/warn_icons'
        states='Sachsen'
        [[[counties]]]
              'Kreis Bautzen - Tiefland'='BTL'
              'Kreis Bautzen - Bergland'='BBL'
        [[[cities]]]
              'Stadt Dresden'='DD'
    [[forecast]]
        icon_set=dwd
        icons='./dwd/icons'
        orientation=h,v
        show_obs_symbols = True # optional
        show_obs_description = False # optional
        show_placemark = True # optional
Downloads a forecast in text form for a configured federal state. Also ground pressure maps and a map with weather warnings.
The following configurations are relevant:
show_text_forecast Show the forecast in text form?
text_forecast_VHDL The VHDL code of the federal state for which the text forecast should be shown, see https://github.com/roe-dl/weewx-DWD/wiki/Abk%C3%BCrzungen-der-Bundesl%C3%A4nder-beim-Deutschen-Wetterdienst (the default value is for Saxony, Germany).
dwd_link Is shown as "source link" below the text forecast (the default value is for Saxony, Germany).
show_pressure_map Show the ground pressure map for Western and Central Europe/North Atlantic (https://www.dwd.de/DWD/wetter/wv_spez/hobbymet/wetterkarten/bwk_bodendruck_weu_ana.png)
show_warning_map Show a map with weather warnings for the selected federal state, which must be set in the weewx.conf, see https://github.com/roe-dl/weewx-DWD#konfiguration-in-weewxconf
Attention: If the ground pressure map or the warning map is used, it must also be specified in the skin.conf:
[CopyGenerator]
    copy_always = dwd/SchilderLZ.jpg, dwd/bwk_bodendruck_weu_ana.png, dwd/bwk_bodendruck_na_ana.png
Shows warnings for counties/cities.
The following configurations are relevant:
show_text_warnings Show warnings in text form for the set counties and cities. These must be entered in the weewx.conf, see https://github.com/roe-dl/weewx-DWD#konfiguration-in-weewxconf
show_warnings_on_front Shows the warnings for the selected region on the start page (e.g. show_warnings_on_front=BBL)
warning_map_filename Filename of the warning map. The links for the different regions can be found here: https://www.dwd.de/DE/wetter/warnungen_aktuell/objekt_einbindung/objekteinbindung_node.html#doc582840bodyText6. Which warning map is downloaded by weewx-DWD must be set in wget-dwd.
Daily / hourly forecast via DWD-Mosmix.
The following configurations are relevant:
show_forecast Show forecast - applies to the start page and the DWD page. If weewx-forecast is also enabled, the forecast from weewx-DWD is used instead.
mosmix_id Mosmix station ID, see https://www.dwd.de/DE/leistungen/met_verfahren_mosmix/mosmix_stationskatalog.cfg?view=nasPublication&nn=16102. Must also be set in the weewx.conf, see https://github.com/roe-dl/weewx-DWD#konfiguration-in-weewxconf
dwd-mosmix as chart
dwd-mosmix can also store the data as sqlite database. This database can then be used by weewx-wdc to display the data as a chart. The setup is described here: https://github.com/roe-dl/weewx-DWD#wettervorhersage-als-diagramm
The skin is pre-configured to show up to 3 charts on the DWD page, which can be configured in the skin.conf, an example configuration with 3 charts could look like this:
...
[DisplayOptions]
    ...
    [[diagrams]]
        [[[combined_observations]]]
            # @see https://github.com/roe-dl/weewx-DWD#wettervorhersage-als-diagramm
            [[[[dwd_meteogram_1]]]]
                data_binding = dwd_binding
                label = Sunshine / Temperature / Dewpoint
                bottom_date_time_format = "%m/%d"
                tooltip_date_time_format = "%x %X"
                [[[[[obs]]]]]
                    [[[[[[sunshineDur]]]]]]
                       unit = minute
                       color = "#E3963E"
                       color_dark = "#E3963E"
                       observation = "sunshineDur"
                       enableArea = True
                       areaOpacity = 0.5
                    [[[[[[outTemp]]]]]]
                        observation = "outTemp"
                        color_dark = "#8B0000"
                    [[[[[[dewpoint]]]]]]
                        observation = "dewpoint"

            [[[[dwd_meteogram_2]]]]
                data_binding = dwd_binding
                label = POP / Rain / Cloud cover
                bottom_date_time_format = "%m/%d"
                tooltip_date_time_format = "%x %X"
                [[[[[obs]]]]]
                    [[[[[[rain]]]]]]
                       observation = "rain"
                    [[[[[[pop]]]]]]
                        observation = "pop"
                        color = "lightblue"
                        color_dark = "lightblue"
                    [[[[[[cloudcover]]]]]]
                        observation = "cloudcover"
                        color = "darkgrey"
                        color_dark = "lightgrey"

            [[[[dwd_meteogram_3]]]]
                data_binding = dwd_binding
                label = Wind speed / Gust speed
                bottom_date_time_format = "%m/%d"
                tooltip_date_time_format = "%x %X"
                areaOpacity = 0.5
                enableArea = True
                [[[[[obs]]]]]
                    [[[[[[windGust]]]]]]
                        observation = "windGust"
                    [[[[[[windSpeed]]]]]]
                        observation = "windSpeed"
The keys under [[[combined_observations]]] must be dwd_meteogram_1, dwd_meteogram_2 and dwd_meteogram_3 so that the charts are displayed on the DWD page. The available observations can be found here: https://github.com/roe-dl/weewx-DWD#wettervorhersage-als-diagramm
The different weather maps provided by weewx-DWD (bwk_bodendruck_na_ana.png, SchilderLZ.jpg, bwk_bodendruck_weu_ana.png) can also be displayed as radar_img on the start page.
radar_html = <img src="dwd/SchilderLZ.jpg" alt="Radar" loading="lazy" /></a> (if the maps are in the web directory in the dwd folder).
If the maps are used, they must be entered in the skin.conf:
[CopyGenerator]
    copy_always = dwd/bwk_bodendruck_na_ana.png, dwd/SchilderLZ.jpg, dwd/bwk_bodendruck_weu_ana.png
Forecast on teh Front page