Allow axis to be cut if range exceeds data #173
Description
I have a bar chart that has Y-axis values that range from 0 - 1. However often times if I have many bars they are all very short (e.g. 100 bars they average 0.01 in height).
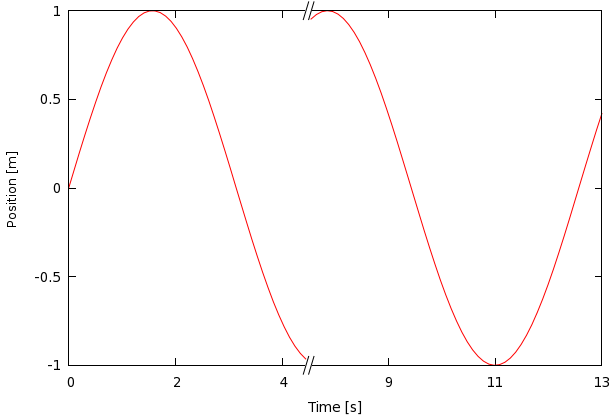
I would like a feature that allows me to show a cut mark on the axis if the specified range is quite a bit larger than the highest data value. Something similar to what we see here: